

Most small shops already inspect garments at final wrap. That's good, but it's not QC in any real sense — it's just the last gate before a customer complaint. Real quality control means you're pulling finished work on purpose, on a schedule, scoring what you find, and doing something when the numbers cross a line you set in advance.
The problem is that "sample some garments and look for problems" collapses into nothing without three things: how often you pull samples, how you classify what's wrong, and what number forces you to stop and fix something. Without those, you end up with a drawer full of QC notes nobody reads and defect rates that drift for weeks before anyone notices.
This is about building that system at a shop pressing a few hundred pieces a day — not a plant running thousands. The scale changes everything. You can't afford a dedicated inspector, and you don't need six-sigma math. You need sampling that fits a two or three person back shop.
Why 100% inspection quietly fails
Most owners fall into this trap. They believe they're inspecting everything at wrap, so sampling feels redundant. But wrap inspection and QC sampling catch completely different failures.
Wrap inspection is fast, fatigued, and biased toward obvious cosmetic issues — a missing button, a visible stain, a crooked crease. The presser who finished the piece is often the one checking it, which means the defects they're blind to while pressing are the same ones they miss at inspection. In real shops, this is exactly where re-deposited soil, faint press shine, and slightly-off hem alignment slip through again and again.
Sampling is different. You pull a small set of already-passed garments and inspect them cold, with a checklist, by someone who didn't do the work. You're not trying to catch every defect on every piece — you're trying to measure your actual defect rate so you can tell when your process is drifting.
A shop can have a 99% pass rate at wrap and still be shipping a 6% true defect rate, because wrap inspection only catches the loud stuff. The quiet stuff — the things customers notice at home three wears later — that's what sampling surfaces.
Setting your sampling frequency
The instinct is to pull a fixed percentage, like "inspect 5% of everything." That's a mistake for small shops, because volume swings hard between a slow Tuesday and a Monday after a holiday weekend. A flat percentage gives you too few samples when it matters and wastes labor when it doesn't.
Never lose track of an order again.
Pressesly helps you manage, track, and communicate every garment order seamlessly.
- Unified order management
- Real-time customer notifications
- Staff scheduling & workload tracking
No credit card required
Better approach: tie sampling to batches and operators, not raw volume.
Think about where defects actually come from. They cluster by cause — a specific presser having an off week, a new solvent batch, a machine that needs adjustment. If you sample randomly across the whole day, you blur those clusters together. Sample per operator per shift and you can actually see which station is drifting.
Here's a frequency framework that works at small-shop scale:
| Daily finished volume | Baseline sample size | When to increase |
|---|---|---|
| Under 150 pieces | 12–15 pieces/day | After any defect spike, go to 25 |
| 150–350 pieces | 20–30 pieces/day | During peak season or new staff, add 50% |
| 350–600 pieces | 35–45 pieces/day | After equipment service, double for 3 days |
Within that daily number, split samples across each active finishing station roughly evenly. If you've got three pressers working, you want samples from all three — not twelve pieces that all came off the same unit.
One more thing people consistently get wrong: pull samples at different times of the shift. A presser's first hour and their last hour before close often look like two different people. Grab a few early, a few mid-shift, a few near the end.
Defect classification that actually guides action
A QC log that just says "defect found" is nearly useless. The value is in the classification, because different defect classes trigger different responses. A missing button is a quick fix. Re-deposited soil is a chemistry or filtration problem that affects every load until you solve it.
Split defects into three severity classes based on what the customer experiences and what it costs you to fix:
Class A — Critical / customer-facing failure These are defects that would generate a complaint, a redo, or a claim if shipped. Fabric damage, color change, shrinkage, lost garment, strong residual odor, broken zipper from processing. One Class A in your sample is a signal, not noise.
Class B — Functional defect, visible but not catastrophic Incomplete stain removal, press shine, uneven creasing, missed spot that was flagged at intake, loose button, light re-deposition. The customer might accept it, might not. These are the ones that quietly erode trust over time.
Class C — Cosmetic / finishing inconsistency Hanger misalignment, slightly wrinkled lining, packaging issues, tag errors, minor static cling. Annoying, cheap to fix, but they add up in how "finished" your work looks and feels.
The reason to separate these isn't bureaucracy. Your action thresholds are completely different per class. You tolerate zero Class A. You tolerate a small, defined rate of Class B. You tolerate more Class C but still track the trend.
One thing worth flagging: everyone scoring samples has to classify the same defect the same way. Spend one short session with your team working through borderline cases — is faint press shine a B or a C? Decide, write it down, stick to it. Classification drift is the single most common reason small-shop QC data becomes meaningless.
Run one short calibration session with your team to align borderline classifications.
Classification drift is the single most common reason small-shop QC data becomes meaningless.
Control limits: knowing when the process has drifted
This is the part most shops skip, and it's what turns sampling from busywork into an early-warning system.
A control limit is just a line that says "this is normal variation" versus "something changed." You don't need statistical software. You need your baseline defect rate per class and a reasonable band around it.
-
Run your sampling for two to three weeks without changing anything.
-
Calculate your average defects per class as a rate — Class B defects found ÷ pieces sampled, for example.
-
That average is your center line. Your upper control limit for Class B sits roughly at double that rate, or at a fixed ceiling you simply won't accept, whichever is lower.
A typical example: a shop sampling 25 pieces a day finds about 1 Class B defect on average — roughly a 4% Class B rate. Center line is 4%. They decide anything over 8% on a single day, or three consecutive days above 5%, means the process has drifted and needs attention.
For Class A, there's no gradual band. The limit is one. A single Class A in a sample of 25 triggers investigation, because statistically, the real population likely has several more.
The pattern to watch isn't a single bad day — those happen. It's the trend. Three days creeping upward tells you more than one spike. A spike might be one tired presser; a trend means your chemistry, equipment, or a training gap is the actual cause.
Action triggers tied to corrective experiments
Measuring drift is pointless if nothing happens when the line is crossed. Each threshold needs a specific, pre-decided action — and specifically, a small experiment rather than a vague "tell everyone to be more careful."
"Be more careful" doesn't fix a process. A corrective experiment isolates one variable, changes it, and checks whether the defect rate moves.
-
Any single Class A defect → Pull the full batch that piece came from. Re-inspect everything processed in that window. Identify root cause before releasing anything. Non-negotiable.
-
Class B rate above upper control limit for one day → Note it, increase next day's sample size by 50%, watch whether it was a blip.
-
Class B rate above center line three days running → Run a corrective experiment. Change exactly one thing — solvent filter, press temperature, operator rotation, pre-spotting time — and track whether the rate drops.
-
Class C trending up over a week → Lower priority. Address at the next team huddle, usually a finishing or packaging habit.
The corrective experiment discipline is what separates shops that actually improve from shops that just log problems. When your Class B rate climbs, resist the urge to change five things at once. If you adjust press temp, swap solvent, and retrain a presser all in the same week and the rate drops, you learned nothing — you can't tell which change mattered and you can't repeat it.
Change one variable. Give it a few days of sampling. Read the result. Then decide. Our final-inspection protocol pairs well here — the photo standards give you an evidence trail to compare before and after an experiment.
A sample corrective experiment, start to finish
Say your Class B rate has sat at 4% for weeks, then climbs to 6%, then 6% again, then 7% over three consecutive days. That's your trigger.
You look at the defect notes and notice most of the Class B hits are incomplete stain removal on protein-based stains. Your hypothesis: pre-spotting dwell time got shortened during a busy stretch.
The experiment: for the next four days, add 30 seconds of dwell time on flagged protein stains and change nothing else. Keep sampling at your increased rate.
If the rate drops back toward 4%, you've confirmed the cause and you bake the longer dwell into the SOP. If it doesn't move, you rule that out and test the next variable — maybe the spotting agent itself, or water temperature. Either way, you're learning instead of guessing.
A simple weekly QC workflow
Running QC well at a small shop isn't about adding a bunch of overhead — it's about keeping the daily habit small enough that it actually happens. Ten or fifteen minutes at the right moments beats an elaborate system that gets skipped on busy days.
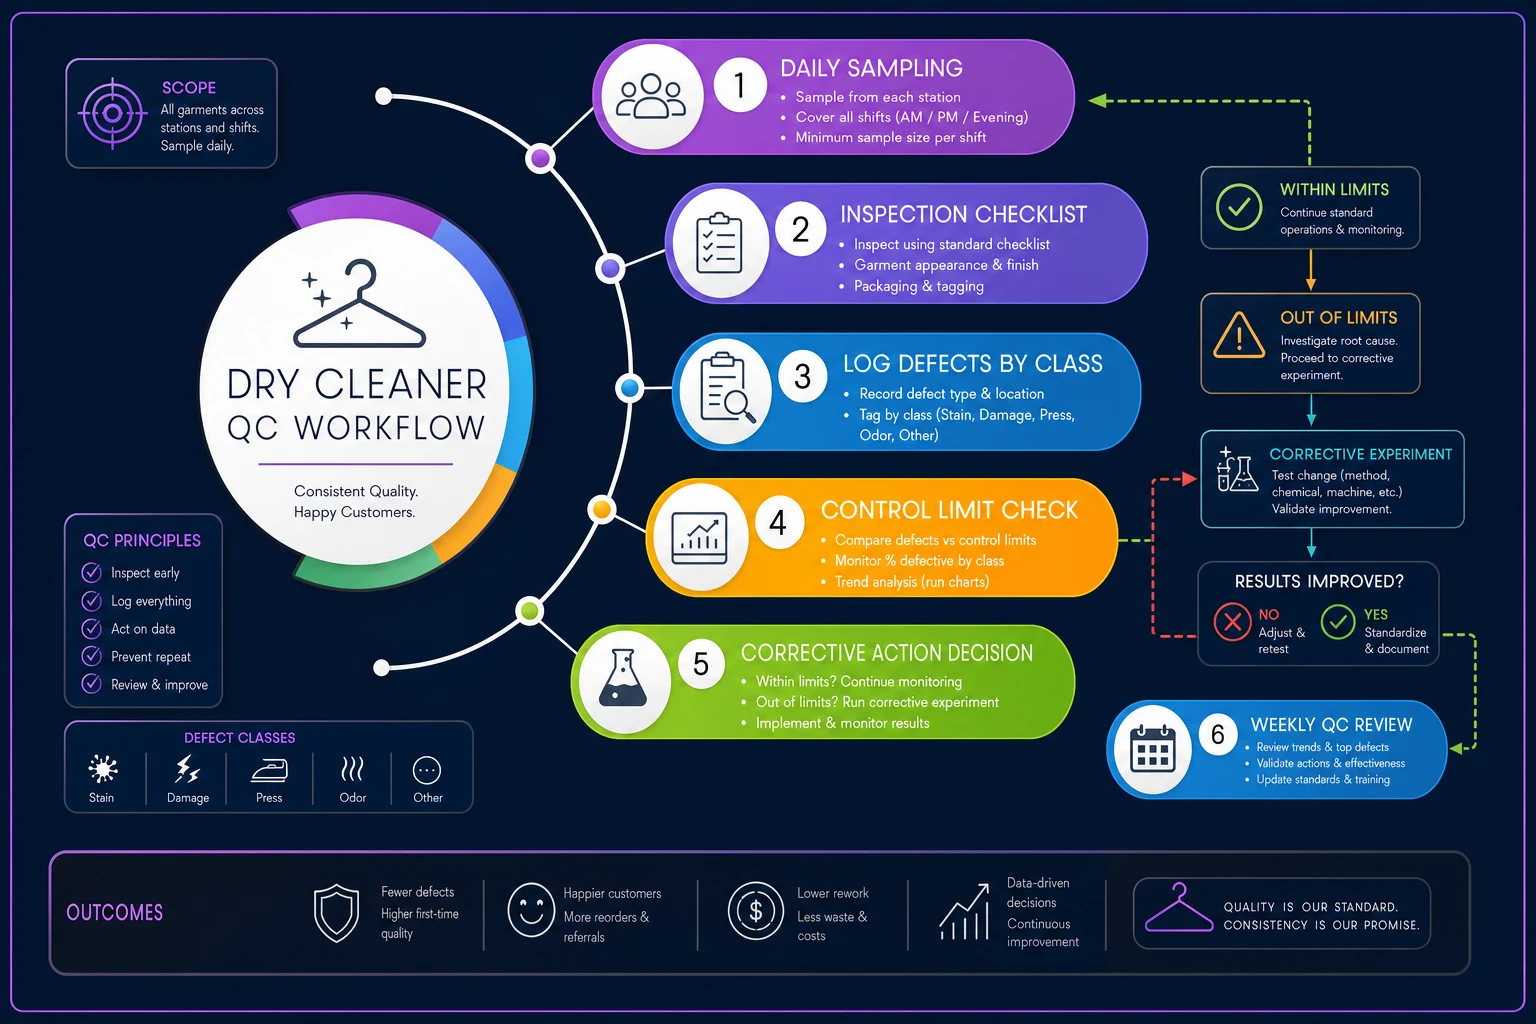
The daily loop is straightforward. Pull samples across stations and times, inspect cold against your checklist, log each defect by class and station, and flag any Class A immediately. At the end of the day, tally defects per class, compare against your control limits, and note whether any trigger fired.
Here's a simple workflow diagram to make the loop obvious at a glance.
Daily (10–15 minutes):
-
Pull the day's samples across stations and times
-
Inspect cold against the checklist
-
Log each defect by class and station
-
Flag any Class A immediately
End of day:
-
Tally defects per class
-
Compare against control limits
-
Note any trigger that fired
Weekly (20–30 minutes):
-
Review the week's trend per class
-
Decide whether any corrective experiment is needed
-
If an experiment is running, read its results and decide
keep, discard, or extend
-
Update the SOP if an experiment confirmed a fix
The whole system lives or dies on whether the daily log actually gets filled in. Paper logs get skipped on busy days — this is just reality. A shared digital checklist, even a simple tablet form at the inspection table, keeps the data honest. You can see at a glance whether today's samples were logged and whether a threshold tripped. The point isn't fancy software; it's that the control limits and triggers are visible and calculated rather than living in someone's head. AI-powered operational software can handle the threshold tracking and flag when a class rate crosses a limit automatically, which takes a lot of the mental load off whoever's running the floor.
Your QC sampling starter checklist
The whole system lives or dies on whether the daily log actually gets filled in.
Use this starter checklist:
-
- [ ] Decide daily sample size based on your volume tier
-
- [ ] Split samples across stations and shift times
-
- [ ] Write a one-page defect classification guide (A/B/C) with borderline examples
-
- [ ] Run 2–3 weeks of baseline sampling before setting limits
-
- [ ] Calculate center line and upper control limit per class
-
- [ ] Define exact action triggers for each threshold
-
- [ ] Assign who inspects (someone who didn't do the work)
-
- [ ] Set the rule
corrective experiments change one variable at a time
-
- [ ] Decide where logs live and who reviews the weekly trend
Decide where logs live and who reviews the weekly trend
When this makes sense — and when it doesn't
This makes sense when you're running enough daily volume that defects have patterns worth measuring, when you've got more than one person finishing garments, or when you've had a run of complaints you can't explain. It also makes sense if you're trying to tighten quality before onboarding a corporate account that'll hold you to standards.
This is a bad idea if you haven't first stabilized your basics — if your turnaround times are chaotic and jobs are constantly rushed, your defect data will just reflect the chaos. Fix flow first, then measure quality. Sampling a process that's already on fire tells you it's on fire, which you already knew.
Who should skip it: a true one-person operation pressing fewer than 50 pieces a day. At that scale, you are the control chart. You know every piece you touched. Formal sampling adds overhead without surfacing anything your own hands didn't already tell you.
The real payoff
A shop that samples well doesn't just catch more defects — it catches causes earlier. There's a real difference between finding out your filtration is failing from a creeping Class B trend versus finding out from a batch of ruined silk blouses. One is a quiet Tuesday adjustment. The other is a week of claims and refunds.
The system doesn't have to be elaborate. A dozen samples a day, a three-class defect guide, a center line and an upper limit per class, and the discipline to run one-variable experiments when a trigger fires — that's enough to turn quality from something you hope for into something you can actually steer.
The system doesn't have to be elaborate. A dozen samples a day, a three-class defect guide, a center line and an upper limit per class, and the discipline to run one-variable experiments when a trigger fires — that's enough to turn quality from something you hope for into something you can actually steer.
Ready to elevate your dry cleaning operations?
Join hundreds of dry cleaners using Pressesly to save time, reduce errors, and enhance customer satisfaction.