

Walk into any dry cleaner and check the back storage. You'll find stacks of wire hangers, boxes of plastic covers, rolls of poly bags—thousands of dollars sitting idle. The average 800-garment-per-week shop ties up around $3,500 in packaging inventory at any given moment. Most owners have no idea what their actual hanger turn-rate is, or how much dead inventory is quietly crushing their margins.
The real problem isn't just cash locked up in supplies. Without tracking turn-rates, you're ordering on gut feeling, you can't negotiate effectively with suppliers, and you miss the fact that certain packaging types sit untouched for months while you constantly run out of others.
Why packaging inventory becomes a silent profit killer
Most dry cleaners order supplies the same way they always have—wait until something runs low, call the supplier, get another batch. That reactive approach creates three expensive problems that compound over time.
First, you lose negotiating leverage. When you're placing rush orders because you're about to run out, suppliers know you need them more than they need you. They have zero incentive to offer better pricing because you'll pay whatever they charge to keep operating.
Second, inconsistent ordering means you can't take advantage of volume breaks. A shop processing 800 garments weekly might order 500 hangers one week, then 2,000 the following month, then nothing for three weeks. Suppliers see that chaos and price accordingly—usually 15-20% higher than they'd charge for predictable, scheduled orders.
The third issue hits harder than most realize: space costs. Every square foot storing excess poly bags or specialty hangers could be generating revenue instead. In urban markets where shops pay $30+ per square foot annually, that corner stacked with six months of garment bags represents real hidden expense—easily $600 or more.
Calculating true hanger turn-rate (not the way suppliers tell you)
Turn-rate calculation for dry cleaning supplies works differently than standard retail inventory metrics. You're not just measuring how fast inventory moves—you're tracking consumption patterns across multiple SKUs with wildly different usage rates.
Never lose track of an order again.
Pressesly helps you manage, track, and communicate every garment order seamlessly.
- Unified order management
- Real-time customer notifications
- Staff scheduling & workload tracking
No credit card required
Monthly garments processed ÷ Average hanger inventory on hand = Turn rate For an 800-garment weekly shop, that's roughly 3,200 monthly garments. If you keep 4,000 hangers in stock, your turn rate is 0.8—meaning you're holding about 1.25 months of inventory. That might sound reasonable until you realize optimal turn rates for consumable supplies should sit at 2.0 or higher, which means no more than two weeks of inventory on hand.
When counting, focus on high-usage SKUs first—savings compound quickly.
-
Wire hangers
Target 2.5 turns monthly
-
Plastic shirt hangers
Target 1.5 turns monthly
-
Poly garment bags (standard)
Target 2.0 turns monthly
-
Specialty covers (gowns/coats)
Target 0.5 turns monthly
-
Paper shoulder covers
Target 3.0 turns monthly
The variation matters. Ordering everything on the same schedule means you'll always have too much of something and too little of something else.
| Item Type | Weekly Usage | Current Stock | Turn Rate | Optimal Stock | Excess $ Value |
|---|---|---|---|---|---|
| Wire hangers | 650 | 3,500 | 0.74 | 1,300 | $88 |
| Poly bags (24") | 420 | 2,800 | 0.60 | 840 | $196 |
| Plastic hangers | 85 | 600 | 0.57 | 170 | $129 |
| Shoulder covers | 200 | 400 | 2.0 | 400 | $0 |
| Specialty bags | 35 | 400 | 0.35 | 140 | $156 |
This shop has $569 in excess inventory just from poor turn-rate management. Factor in carrying costs over a full year and you're looking at nearly $800 in unnecessary expense—from packaging alone.
The 12-week waste reduction timeline
Fixing hanger optimization for your dry cleaner isn't something you overhaul overnight. The shops that actually reduce packaging costs by 20-30% follow a specific timeline that balances quick wins with sustainable improvements.
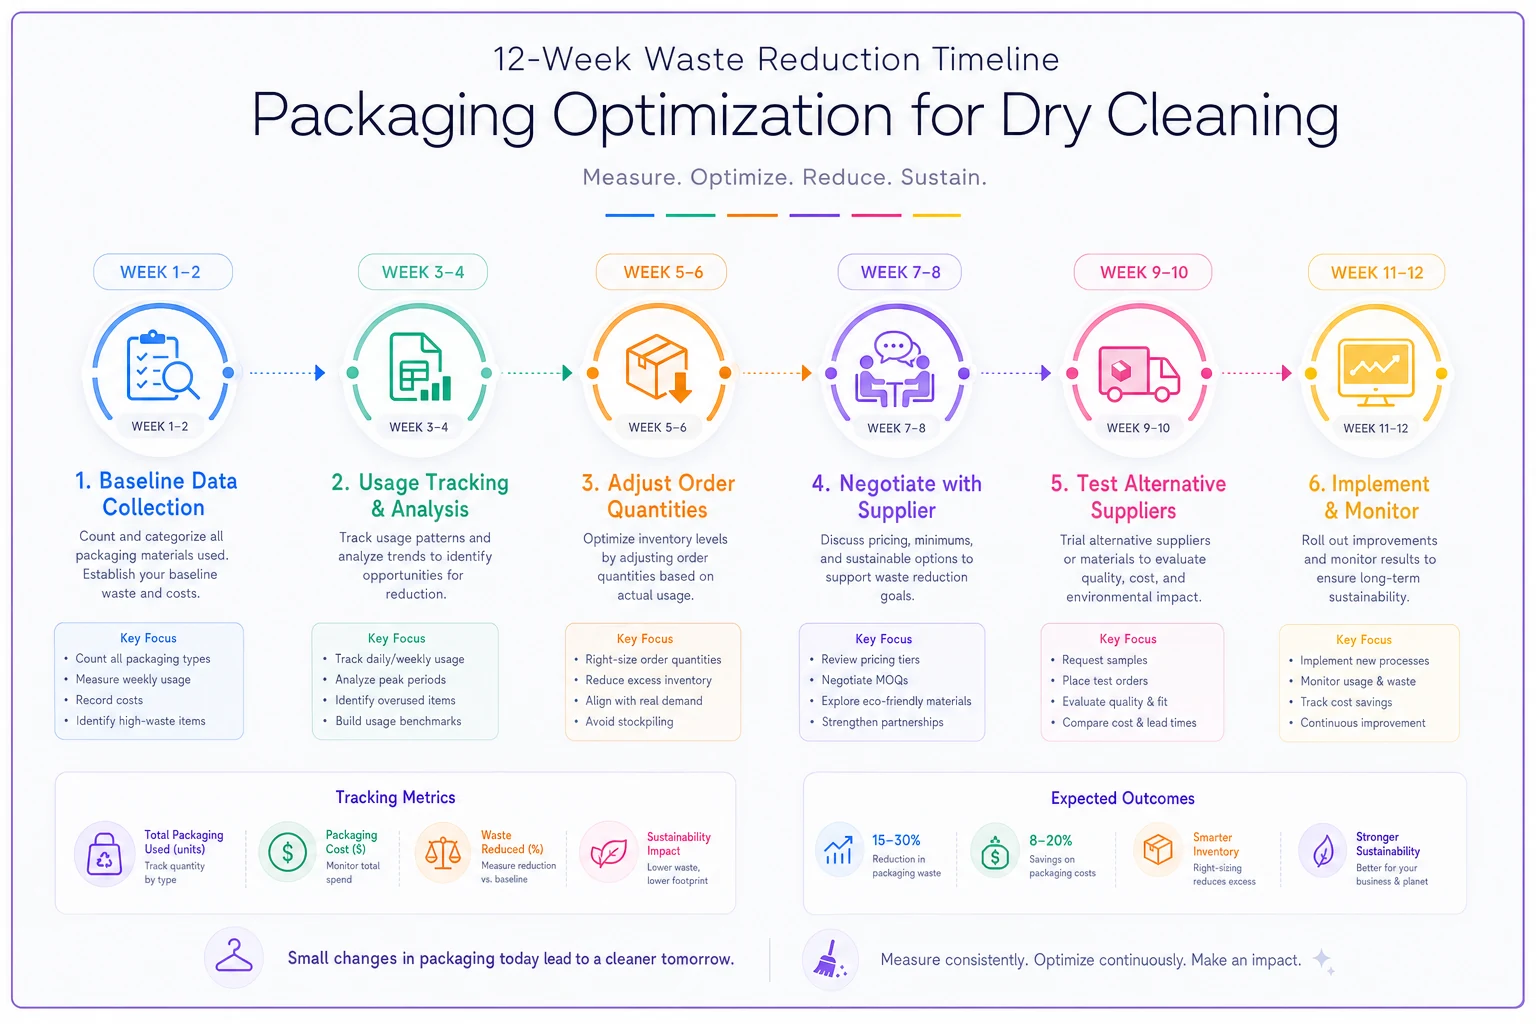
Weeks 1-2: Baseline data collection Count everything. Not estimates—actual counts. Most shops discover they have 30-40% more inventory than they thought. Track daily usage for each packaging type and get at least 10 business days of data before drawing conclusions. Mark any specialty items that haven't moved in two weeks. One shop in suburban Chicago found 14 boxes of vintage wooden hangers taking up an entire shelf. They'd been sitting there for three years because the previous owner got a "great deal" on them. That's $400 in dead money plus valuable storage space gone.
Weeks 3-4: Implement usage tracking Create a simple consumption log. Every time staff opens a new box of hangers or roll of poly, they mark it down. It feels tedious at first, but without accurate consumption data, you can't optimize anything. The tracking sheet doesn't need to be complicated:
-
Date
-
Item type
-
Quantity opened
-
Staff initials
After two weeks, patterns start showing up. Maybe Tuesday through Thursday consume 60% of your weekly hangers. Maybe specialty bags spike during prom season and sit idle the rest of the year.
Weeks 5-6: Adjust order quantities Based on your consumption data, recalibrate order sizes. If you're using 650 wire hangers weekly, ordering 5,000 at once means carrying almost two months of inventory. Cut that to 1,500 and order more frequently. Yes, you might pay slightly more per unit, but the cash flow improvement and reduced storage needs offset it.
Weeks 7-8: Negotiate with your current supplier Armed with precise consumption data, approach your supplier with a proposal: consistent, scheduled orders in exchange for better pricing. Show them your 8-week usage history. Propose a standing order—1,500 hangers every two weeks, 800 poly bags monthly, 200 shoulder covers weekly. Suppliers prefer predictable orders because it helps their own inventory planning. Building consistent operational rhythms extends well beyond customer service—it affects every part of the business, including supplier relationships.
Weeks 9-10: Test alternative suppliers While negotiating with your current supplier, quietly test alternatives. Order small quantities from two or three other vendors. Compare price, but also delivery reliability and minimum order requirements.
Weeks 11-12: Implement and monitor Lock in your new ordering system. Set calendar reminders for reorder points. Keep tracking consumption to catch seasonal variations you might have missed in your initial two weeks. Most importantly, calculate your new turn rates monthly.
A shop in Phoenix following this timeline reduced their packaging inventory from $3,800 to $2,100 while never once running out of supplies. The freed cash flow let them upgrade pressing equipment a month earlier than planned.
Here's a visual of the 12-week timeline if you prefer following a workflow graphic.
The better implementations also connect packaging management to broader operations. When your system knows next week's scheduled pickups include three wedding parties, it can flag a check on specialty packaging inventory. When silk blouse repairs are up 30%, it suggests ordering more delicate garment bags before you run short. That kind of proactive coordination is hard to replicate with a spreadsheet.
Scripts that actually work in supplier negotiations
Negotiating with suppliers feels uncomfortable for a lot of shop owners, especially those who've used the same vendor for years. But suppliers expect negotiation—they build margin into initial quotes assuming you'll push back. The key is approaching it with specific asks rather than vague requests for "better pricing."
Opening script for existing suppliers:
"Hi [Supplier Name], I've been looking at our ordering patterns and want to discuss a more structured approach. We've been ordering reactively, which creates inefficiency for both of us. I'd like to propose a scheduled ordering system. Currently we place orders randomly—sometimes weekly, sometimes monthly. Our analysis shows we consistently use [specific quantities] of each item per month. What pricing could you offer if we committed to scheduled standing orders? For example, 1,500 hangers every two weeks, delivered on Tuesdays."
This frames the conversation as mutual benefit rather than confrontation. You're offering predictability in exchange for better terms.
When they push back on pricing:
"I understand your position. Let me share our consumption data from the past three months. As you can see, we're a consistent customer using [total annual volume]. At current pricing, that's roughly $[annual spend] in business. Other suppliers have quoted [competitor price] for similar volumes with scheduled ordering. Price isn't everything, but the difference is significant enough that we need to consider alternatives. What flexibility do you have to match or come closer to that rate?"
Never bluff about competitor quotes. If you say another supplier offered a specific price, be prepared to show the quote if asked.
For minimum order pushback:
"The 5,000-unit minimum creates cash flow challenges for us—it forces us to carry 8 weeks of inventory, which ties up capital we need for operations. What if we committed to a minimum annual volume instead? Say 40,000 hangers per year, delivered in bi-weekly shipments of 1,500? You'd get the same total business with better predictability on your end."
Closing the deal:
"Based on our discussion, here's what would work for our operation: standing order of [specific quantities] delivered every [timeframe], price of $[amount] per unit for hangers and $[amount] for poly bags, net 30 payment terms, one-week notice for any order modifications, and quarterly price reviews based on volume. Can we move forward on these terms?"
KPIs that prove packaging cost reduction
Tracking turn-rates and negotiating better prices means nothing if you can't measure the actual impact on your COGS. Most shops track supply costs as one giant line item, which makes it nearly impossible to see whether optimization efforts are working.
Break your packaging KPIs into specific, measurable metrics.
Primary KPI: Packaging cost per garment processed Total monthly packaging costs ÷ Total garments processed = Cost per garment The average shop spends somewhere between $0.28 and $0.35 per garment on packaging. Optimized operations get this below $0.22. Track it weekly to catch problems early.
Secondary KPI: Inventory carrying cost (Average inventory value × Monthly carrying rate) ÷ Garments processed Most shops ignore carrying costs entirely, but they add up. Figure roughly 2% monthly for the cost of money tied up in inventory plus storage space. A shop with $3,500 in average packaging inventory faces around $70 monthly in carrying costs—$840 annually—just sitting there.
Efficiency KPI: Order frequency ratio Number of rush orders ÷ Total orders placed If more than 20% of your supply orders are rush orders, you're bleeding money on expedited shipping and missing negotiation opportunities. Well-managed shops keep this below 5%.
Waste KPI: Obsolete inventory percentage Value of supplies unused for 90+ days ÷ Total inventory value Anything above 10% is a problem. You're either buying things you don't need or ordering in quantities that don't match consumption.
Track these on a simple dashboard—even a spreadsheet works:
| Month | $/Garment | Carrying Cost | Rush Order % | Obsolete % |
|---|---|---|---|---|
| January | $0.34 | $72 | 35% | 18% |
| February | $0.31 | $68 | 25% | 16% |
| March | $0.28 | $61 | 15% | 12% |
| April | $0.25 | $54 | 8% | 8% |
This shop cut packaging costs by 26% in four months just by managing turn-rates and negotiating with data in hand.
Converting from wire hangers to mixed inventory
One opportunity most shops miss: not every garment needs the same hanger. Using wire hangers for everything is like using a sledgehammer for every nail. Smart hanger optimization means matching packaging to garment type and customer expectations.
Premium garments—suits, dresses, coats—deserve better presentation. Upgrading to formed plastic hangers costs roughly $0.18 more per piece but can justify premium pricing. Strategic service bundling becomes easier when the packaging itself communicates quality.
-
60% standard garments
Wire hangers ($0.08 each)
-
25% shirts
Formed plastic hangers ($0.22 each)
-
10% premium items
Wood-tone hangers ($0.45 each)
-
5% specialty items
Appropriate specialty hangers
This mixed approach adds roughly $0.06 per garment to packaging costs but enables premium pricing on 40% of your volume. If you charge just $0.50 more for "premium presentation" on those items, you're netting an extra $160 weekly after the increased hanger cost.
The operational side matters too. Formed plastic hangers don't tangle like wire ones. Staff spend less time fighting with hanger bundles, which cuts both labor costs and frustration. One shop timed it: untangling wire hangers ate about 8 minutes per 100 hangers. Switching to formed plastic for shirts eliminated that entirely, saving roughly 20 minutes daily.
Seasonal packaging adjustments nobody talks about
Most optimization guides treat packaging needs as constant, but dry cleaning has dramatic seasonal swings that affect what you actually use. Wedding season, holidays, and weather changes all shift packaging requirements in ways that aren't obvious until you've tracked a full year.
May through August, formal wear spikes. You'll process more gowns and suits requiring specialty bags and premium hangers. But if you stock up on those expensive supplies in March and they sit until May, you've tanked your turn-rate for two months for no reason.
-
Spring (March-May) Increase specialty bags by 40%
-
Spring (March-May) Add extra shoulder covers for light jackets
-
Spring (March-May) Reduce heavy garment bags by 50%
-
Summer (June-August) Maximize formal wear packaging
-
Summer (June-August) Increase white tissue paper for wedding dresses
-
Summer (June-August) Stock extra large bags for multi-piece orders
-
Fall (September-November) Transition to heavier garment bags
-
Fall (September-November) Increase coat hangers
-
Fall (September-November) Stock up on standard supplies for the holiday rush
-
Winter (December-February) Heavy-duty hangers for coats
-
Winter (December-February) Extra-large bags for bulky items
-
Winter (December-February) Reduce formal wear packaging by 30%
The mistake shops make is ordering based on last month's usage when they should be thinking about next month's expected needs. It takes a full year of tracking to get this right, but once you have it, ordering becomes far less reactive.
When AI-powered inventory management makes sense
At some point, manually tracking turn-rates and calculating reorder points becomes overwhelming. Shops processing over 1,200 garments weekly often find that spreadsheet tracking eats too much time to maintain consistently.
This is where AI-powered operational software can genuinely make a difference. Modern platforms can track consumption patterns, predict seasonal variations, and generate purchase orders automatically when inventory hits reorder points—without someone babysitting a spreadsheet every week.
The real value isn't just automation, though. It's pattern recognition. These systems spot correlations humans miss—like how weather patterns affect specialty bag usage, or how local events shift formal wear packaging demand. One platform we've worked with reduced packaging costs by around 18% just by optimizing order timing based on historical patterns and predicted demand.
That said, automation only works when you've already built solid processes underneath it. Shops that try to automate chaos just get faster chaos. Get your turn-rates under control manually first, establish your KPIs, then consider software to maintain and improve what you've built.
Making the numbers real
To make this concrete—a family-owned cleaner in suburban Dallas processed around 850 garments weekly with annual revenue of roughly $380,000. Their packaging costs ran $1,100 monthly, about $0.32 per garment.
After implementing turn-rate tracking, they found the following excess inventory sitting in their back room:
-
Wire hangers
3.5 months worth ($1,400 tied up)
-
Poly bags
4 months worth ($800 tied up)
-
Specialty items
8 months worth ($600 tied up)
-
Total excess inventory
$2,800
They followed the 12-week reduction plan. In week 4, they discovered they were using 15% fewer hangers than they'd been ordering—garments picked up in boxes or on customer hangers didn't need new ones. By week 7, they'd negotiated a 12% price reduction with their supplier by committing to bi-weekly scheduled orders.
By week 12, packaging cost per garment had dropped to $0.24 from $0.32, monthly packaging spend fell to $840 from $1,100, and total inventory value dropped from $3,400 to $1,600. The annual savings came out to $3,120 in direct costs plus roughly $1,800 in freed cash flow. The owner used that to upgrade pressing equipment two months earlier than planned, which improved quality and reduced rework. Hanger optimization isn't just about saving money on supplies—it frees up resources for the kind of improvements that actually move the business forward.
Packaging optimization seems like small potatoes compared to bigger operational challenges. That's exactly why it's such an opportunity. While competitors obsess over marketing, you can quietly reduce your COGS by 20-30% just by managing turn-rates properly and negotiating with actual data behind you.
The math is straightforward: the average shop wastes somewhere between $8,000 and $10,000 annually on poor packaging management. That's pure profit flowing to your bottom line when you fix it. Start by measuring your actual turn-rates this week. Count your inventory, track consumption for two weeks, then calculate where you stand.
Once you know your numbers, the rest follows. Negotiate from a position of knowledge, not desperation. Order based on data, not gut feeling. Track KPIs that actually tie to profitability. And when the manual process is running well, consider whether AI-powered tools can maintain and improve your gains without constant oversight.
Your hangers might be eating $8,000 a year right now. The shops that consistently outperform competitors understand that operational discipline means optimizing every part of the business—especially the unglamorous parts everyone else ignores.
Ready to elevate your dry cleaning operations?
Join hundreds of dry cleaners using Pressesly to save time, reduce errors, and enhance customer satisfaction.