

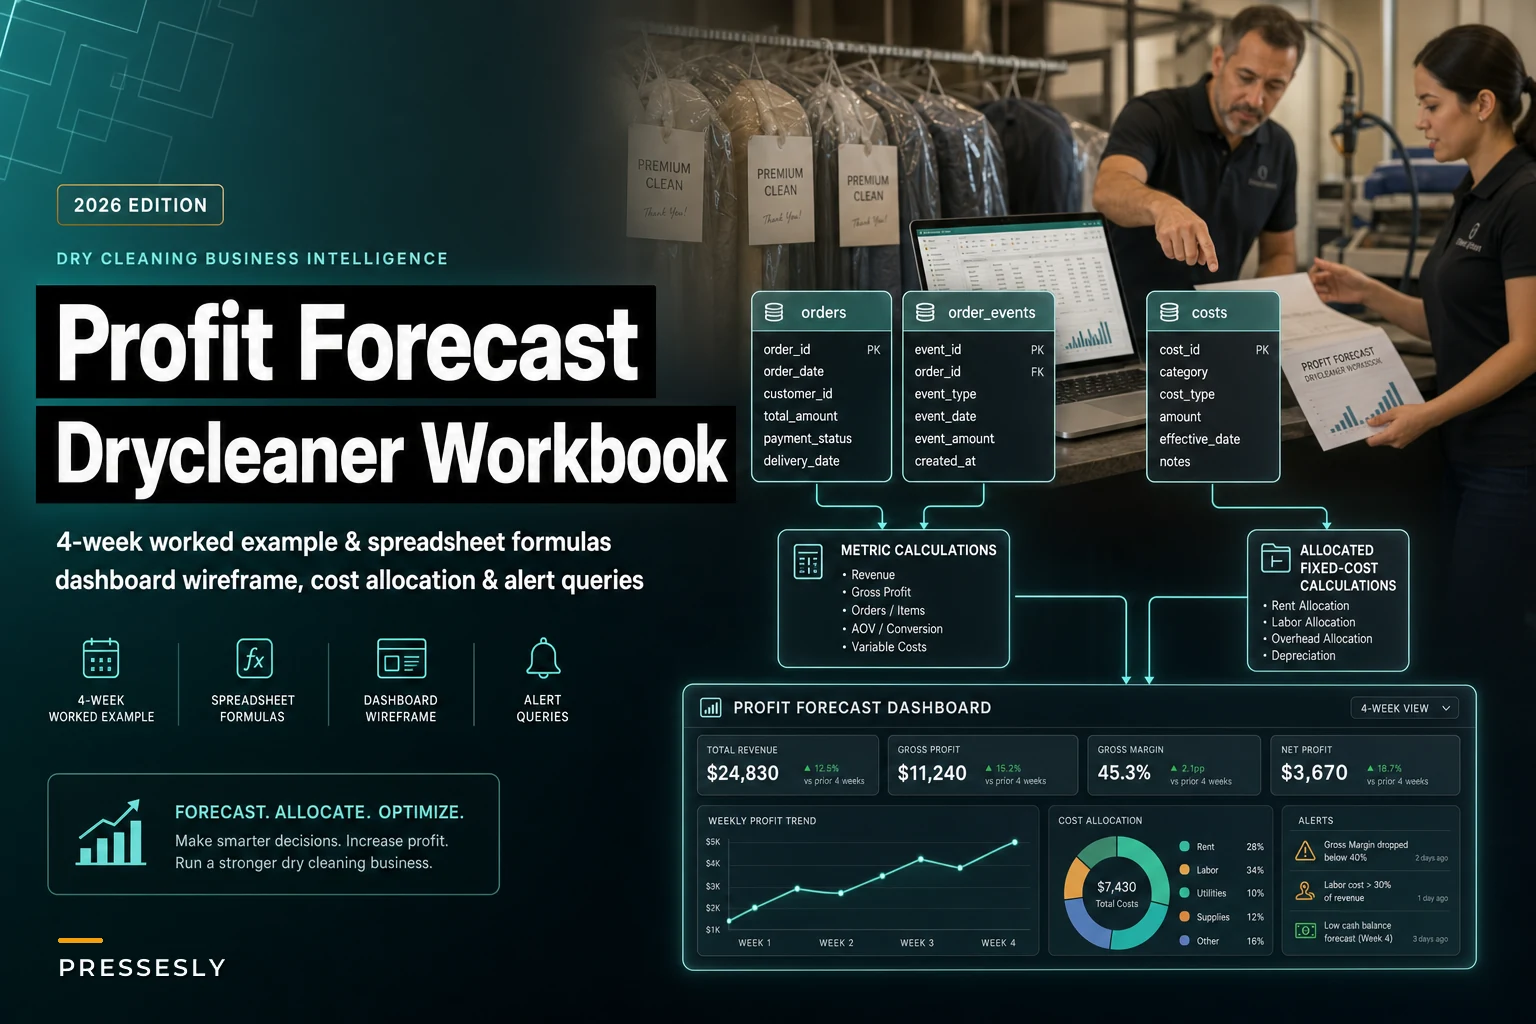

If you've already read which KPIs actually predict profit at a dry cleaning shop, you know what to watch. This is the part that got skipped: the math. The formulas. The aggregation windows. The schema you'd need if you ever wanted the shop to track this stuff without you typing numbers into a spreadsheet at 9pm.
Most owners never build a real profit forecast because it's genuinely tedious. You end up with a revenue guess, a vague sense of costs, and a gut feeling about margin. So let's do the tedious part once, properly, with numbers you can adapt to your own shop.
Everything below is spreadsheet-ready. Column references assume a simple layout you can rebuild in Google Sheets or Excel in an afternoon.
The 4‑Week Worked Example (Base / Best / Worst)
Single-location shop. Roughly 1,900 pieces a week in the base case, average ticket around $4.30 per piece across a mix of shirts, dry-clean, and press-only. Four weeks so one bad week doesn't distort the picture.
Here's the base-case skeleton. The categories are tight on purpose — you can split further once you've got clean data flowing.
| Line | Week 1 | Week 2 | Week 3 | Week 4 | 4‑Wk Total |
|---|---|---|---|---|---|
| Pieces processed | 1,880 | 1,940 | 1,820 | 2,010 | 7,650 |
| Gross revenue | $8,084 | $8,342 | $7,826 | $8,643 | $32,895 |
| Solvent + supplies (variable) | $612 | $631 | $592 | $654 | $2,489 |
| Poly, hangers, tags | $438 | $452 | $424 | $469 | $1,783 |
| Direct labor (production) | $3,120 | $3,180 | $3,050 | $3,290 | $12,640 |
| Card/processing fees | $186 | $192 | $180 | $199 | $757 |
| Contribution margin | $3,728 | $3,887 | $3,580 | $4,031 | $15,226 |
| Fixed costs (allocated) | $3,050 | $3,050 | $3,050 | $3,050 | $12,200 |
| Net profit | $678 | $837 | $530 | $981 | $3,026 |
Base case: contribution margin runs about 46% of revenue, net profit lands near 9%. Healthy-ish for a single shop, not spectacular.
Best case — bump volume 8%, hold fixed costs, assume you plugged one leak (poly waste, say). Contribution margin nudges to ~48%, net profit gets closer to 13–14%.
Worst case — slow month, volume down 10%, a temp covering shifts so labor percentage climbs, and a solvent price bump. Contribution margin drops toward 42%, and net profit can slide under 4% — sometimes to breakeven. That worst-case row is the one people never model, and it's exactly the one that ambushes them in February.
Running three scenarios isn't about precision. It's about seeing how thin the floor is. When your worst case is breakeven, you know a single broken boiler week doesn't just cost repair money — it wipes the month.
Spreadsheet Formulas for Every Metric (with aggregation windows)
Assume your daily data lands in a raw tab with one row per order. These are the working formulas — adjust column letters to your sheet.
Never lose track of an order again.
Pressesly helps you manage, track, and communicate every garment order seamlessly.
- Unified order management
- Real-time customer notifications
- Staff scheduling & workload tracking
No credit card required
Average ticket — aggregate weekly, review monthly:
=SUM(Revenuerange) / COUNTA(OrderIDrange)
Revenue per piece — weekly:
=SUM(Revenuerange) / SUM(Piecesrange)
Contribution margin (per period):
=SUM(Revenue) - SUM(VariableCosts) where VariableCosts = solvent + supplies + poly/hangers + direct production labor + processing fees.
Contribution margin % — weekly, trended over 8 weeks so one bad week doesn't scare you:
=(SUM(Revenue) - SUM(VariableCosts)) / SUM(Revenue)
Labor as % of revenue — weekly (your early-warning metric):
=SUM(ProductionLabor) / SUM(Revenue) Anything drifting above ~40% for production-only labor deserves a look.
Rework rate — weekly:
=COUNTIF(Statusrange,"REWORK") / COUNTA(OrderIDrange)
Net profit margin — monthly (fixed costs only make sense at monthly granularity):
=(SUM(Revenue) - SUM(VariableCosts) - MonthlyFixedCosts) / SUM(Revenue)
A quick note on aggregation windows, because this trips people up more than almost anything else. Track volume and labor % weekly. Track contribution margin on an 8-week rolling basis so you're seeing trend, not noise. Track net profit monthly, because fixed costs are monthly by nature and calculating them weekly creates fake volatility. Mixing these windows is the most common reason a dashboard "looks wrong."
Quantifying Ghost Labor and Rework Cost
Ghost labor is paid time that produces nothing sellable — rework, re-pressing, hunting for a misplaced order, redoing a ticket. It rarely shows up as a line item, which is exactly why it eats margin quietly.
Here's a workable method. Pick a two-week window and log rework and search events, even roughly.
Rework cost formula:
Rework cost = (rework pieces) × (avg minutes per rework) × (loaded labor cost per minute)
A typical example: say you re-press about 90 pieces over two weeks, averaging 6 minutes each, at a loaded rate of $0.42/minute.
90 × 6 × $0.42 = $226 over two weeks
That's roughly $5,900 a year in labor going straight into redoing work — before you count the pieces you comp or the customers who don't come back. That number alone justifies the final-inspection and work-cell fixes you may already be running.
Log rework weekly to spot trends before they compound into large annual costs.
Ghost labor from searching works the same way. If staff spend even 25 minutes a day locating orders across two people, that's roughly 50 minutes daily at ~$0.42/min — about $5,400 a year just walking around looking for things.
The mistake owners make isn't ignoring rework — it's assuming it's "just part of the job" and never putting a dollar figure on it. Once it's a number, it competes for attention against every other fix, and it usually wins.
Fixed‑Cost Allocation and Multi‑Service Profitability
You run more than one service. Shirts, dry clean, alterations, wash-and-fold, maybe delivery. Blending them into one margin number hides which service is actually carrying the shop.
Allocate fixed costs by a driver that reflects real usage. Labor minutes is usually the honest choice — a service that hogs your presser's time should absorb more overhead than one that doesn't.
Fixed-cost allocation per service:
Allocated fixed = TotalFixed × (service labor minutes / total labor minutes)
Then service-level profit:
Service profit = Service revenue - Service variable cost - Allocated fixed
A pattern worth watching: alterations often look high-margin per ticket but consume a lot of labor minutes per dollar of revenue. When you allocate overhead by labor time instead of revenue, some alteration work quietly turns into a low-single-digit margin — occasionally a loss. Wash-and-fold has the opposite dynamic: low ticket, but light on skilled labor, so it can subsidize the shop more than owners expect.
Run this once a quarter. You're not looking for perfection — you're looking for the one service that's secretly underwater.
A Minimal Event Schema to Automate Tracking
The whole reason people abandon profit forecasts is manual data entry. If your point-of-sale or job-ticket system emits clean events, most of these formulas populate themselves. Here's a minimal schema that covers everything above.
orders table
-
order_id -
created_at -
promised_at -
completed_at -
pieces -
service_type -
revenue -
channel(walk-in, delivery, corporate, subscription)
order_events table
-
event_id -
order_id -
eventtype(INTAKE, CLEANED, PRESSED, INSPECTED, REWORK, READY, PICKEDUP) -
event_at -
staff_id
costs table
-
cost_id -
date -
category(solvent, poly, labor, fixed) -
amount -
service_type(nullable)
Three tables. From order_events you can compute rework rate, labor minutes between event stages, and turnaround time. From orders you get everything on the revenue side. Keep the schema this small on purpose — every extra field is a field someone forgets to fill in.
If you're already logging job tickets with timestamps and status codes, you're most of the way there. The events are what make the forecast self-updating instead of a weekly chore.
Here's a simple workflow diagram to visualize the event schema.
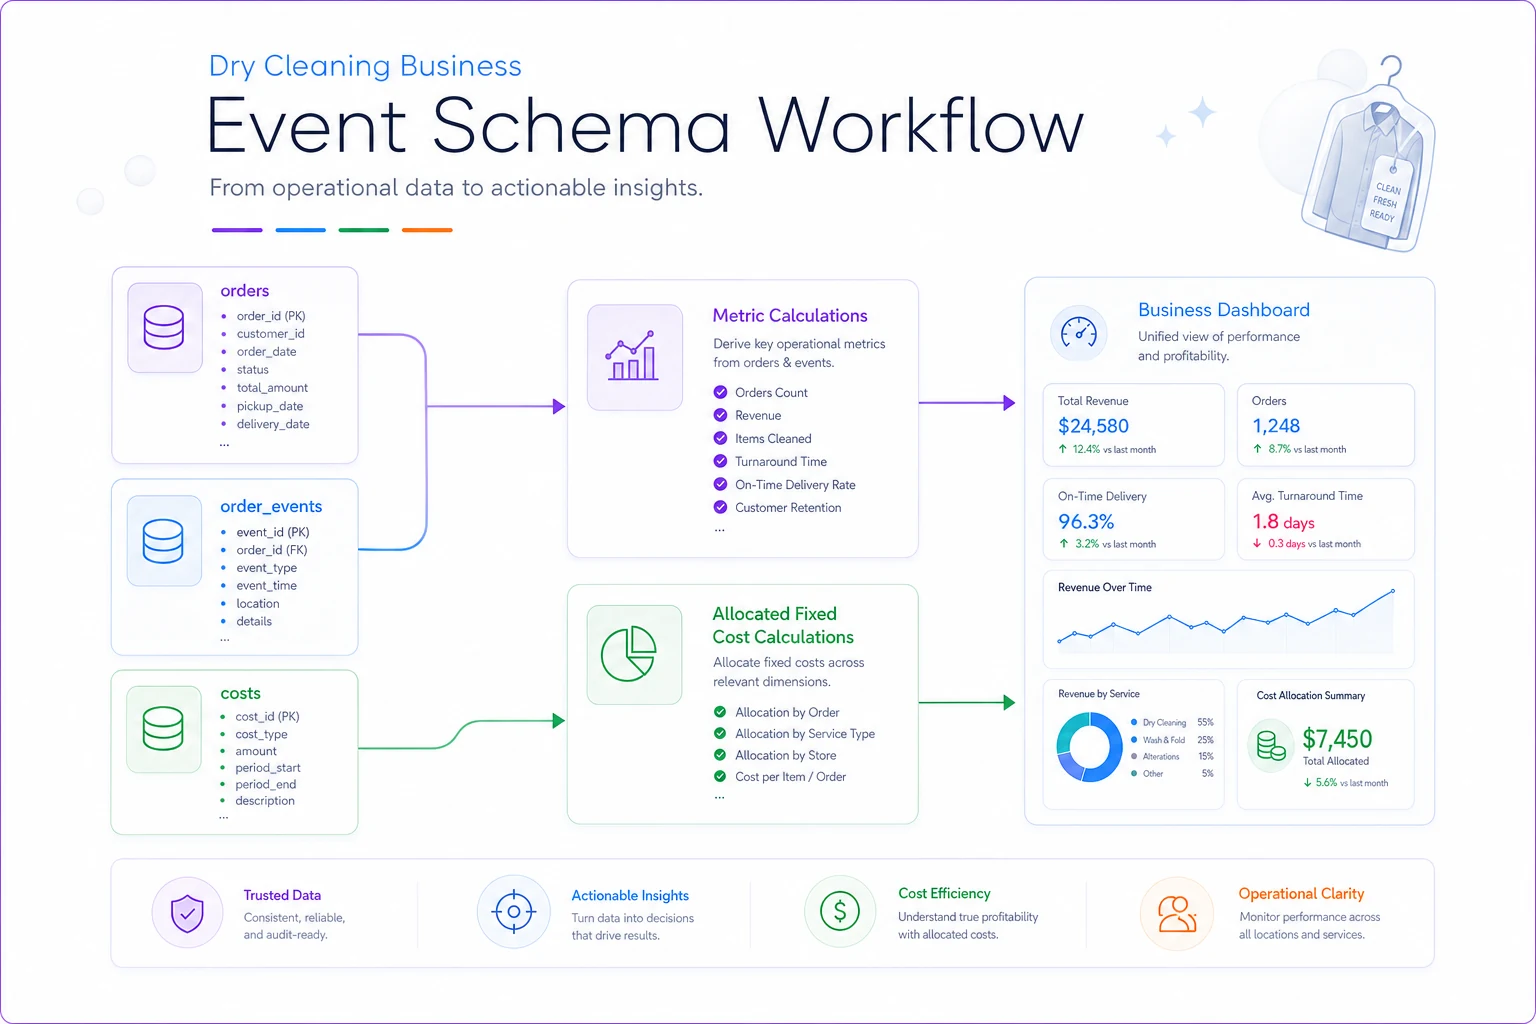
The events feed the metrics; the metrics feed the dashboard. Keep the flow tight and obvious.
The One‑Screen Dashboard Wireframe
Everything on one screen, glanceable in ten seconds. If it needs scrolling, it won't get looked at.
┌─────────────────────────────────────────────────────┐ │ [Net Profit MTD] [Contribution %] [Labor % Rev] │ │ $2,180 46.2% 38.4% │ ├──────────────────────────┬──────────────────────────┤ │ Revenue trend (8 wk) │ Rework rate (8 wk) │ │ ▁▂▃▅▄▆▅▇ │ ▃▂▂▄▃▂▁▂ │ ├──────────────────────────┼──────────────────────────┤ │ Profit by service │ Avg ticket (4 wk) │ │ Shirts ▇▇▇▇ │ $4.31 │ │ DryClean▇▇▇▇▇▇ │ │ │ Alter ▇▇ │ Turnaround: 26.4 hrs │ └──────────────────────────┴──────────────────────────┘
Exact widget list and data sources:
-
Net Profit MTD (big number) — from
costs+orders, monthly window -
Contribution % (big number) —
orders.revenueminus variablecosts, 8-wk rolling -
Labor % of Revenue (big number, colored) —
costswhere category=labor /orders.revenue, weekly -
Revenue trend (sparkline, 8 wk) — weekly sum of
orders.revenue -
Rework rate (sparkline, 8 wk) — REWORK events / total orders
-
Profit by service (horizontal bars) — service profit method above
-
Avg ticket (number, 4 wk) — revenue / order count
-
Turnaround (number) — median of
completedat - createdat
The three big numbers at the top are the ones that predict trouble. Everything below them is for diagnosing why when one of those goes red.
Sample Alert Queries and Conditional Formatting
The dashboard tells you what happened. Alerts tell you before you'd otherwise notice. These queries can go into Metabase or run directly against a Postgres/MySQL back end.
SELECT DATETRUNC('week', o.createdat) AS wk, SUM(c.amount) FILTER (WHERE c.category='labor') / NULLIF(SUM(o.revenue),0) AS laborpct FROM orders o LEFT JOIN costs c ON DATETRUNC('week', o.createdat) = DATETRUNC('week', c.date) GROUP BY 1 HAVING SUM(c.amount) FILTER (WHERE c.category='labor') / NULLIF(SUM(o.revenue),0) > 0.40 ORDER BY 1 DESC;
WITH weekly AS ( SELECT DATETRUNC('week', eventat) AS wk, COUNT() FILTER (WHERE eventtype='REWORK')::float / NULLIF(COUNT(DISTINCT orderid),0) AS reworkrate FROM orderevents GROUP BY 1 ) SELECT FROM weekly WHERE reworkrate > ( SELECT AVG(reworkrate) * 1.5 FROM weekly WHERE wk >= NOW() - INTERVAL '8 weeks' );
SELECT servicetype, SUM(revenue) - SUM(variablecost) - SUM(allocatedfixed) AS profit FROM serviceplview GROUP BY servicetype HAVING SUM(revenue) - SUM(variablecost) - SUM(allocatedfixed) < 0;
Conditional formatting rules for the sheet version (if you're not on SQL yet):
-
Labor % cell
green under 36%, yellow 36–40%, red above 40%
-
Contribution % cell
red under 42%, yellow 42–45%, green above
-
Rework rate
red if this week > 1.5× the 8-week average
-
Net profit
red if negative — but also yellow if under 5%, because 5% net is where a single bad week starts to matter
The 1.5× multiplier on rework is deliberate. Absolute thresholds create alarm fatigue — a shop that always runs 3% rework doesn't need an alert at 3.1%. Relative-to-baseline alerts catch the change, which is what actually signals a problem.
Low‑Cost Tech Recommendations by Scale
You don't need enterprise software to run this. Match the tool to the shop.
| Shop scale | Data layer | Dashboard | Alerting | Rough monthly cost |
|---|---|---|---|---|
| Under 1,500 pcs/wk | Google Sheets | Sheets charts | Sheets + email triggers | $0–$15 |
| 1,500–4,000 pcs/wk | POS export → Airtable | Metabase (free tier) | Metabase alerts | $0–$50 |
| Multi-service / 4,000+ | Postgres | Metabase / self-host | Metabase + Slack webhook | $50–$150 |
Start smaller than you think you need. A shop doing 1,600 pieces a week gets 90% of the value from a well-built Google Sheet with conditional formatting. Metabase becomes worth it once manual copy-paste from your POS starts eating an hour a week — that's your real upgrade signal, not piece count.
When This Full Workbook Makes Sense (and When It Doesn't)
When it makes sense: You've got at least a few months of order data, more than one service line, and a nagging feeling that your margin isn't where it should be but you can't point to why. This workbook turns that feeling into a service-level, week-by-week answer.
When it's overkill: A brand-new shop with three weeks of data has nothing to trend. Get to a couple months of clean records first. Running an 8-week rolling contribution margin on 3 weeks of data just produces confident-looking noise.
Who should skip the SQL parts: If nobody in the shop is comfortable with a database, don't force it. The spreadsheet version with conditional formatting delivers the same decisions. The queries are there for when you outgrow the sheet, not before.
Monthly and Quarterly Review Agenda
The forecast is worthless if nobody sits with it. Keep the cadence short and structured.
Monthly review (30 minutes):
-
Read the three top numbers — net profit, contribution %, labor %. Any red?
-
Look at the rework sparkline. Trending up? Pull the last two weeks of REWORK events and find the pattern.
-
Compare actual net profit to your base-case forecast. Which line drove the gap?
-
Note one thing to watch next month. Write it down.
Quarterly review (60 minutes):
-
Rerun service-level profitability with fresh fixed-cost allocation.
-
Rebuild base / best / worst for the coming quarter using the last 12 weeks.
-
Review whether any alert threshold fired too often (adjust) or never fired (probably too loose).
-
Pick one experiment.
Experiment checklist for the quarter:
-
- [ ] One measurable variable (poly usage, rework rate, one service's price)
-
- [ ] A baseline number pulled before you change anything
-
- [ ] A defined window (4 weeks is usually enough)
-
- [ ] A single success metric written down in advance
-
- [ ] A rollback plan if contribution margin drops instead of rising
That last point matters more than the experiment itself. The shops that improve margin steadily aren't the ones with the cleverest ideas — they're the ones who measure the before, run one change at a time, and actually kill the changes that didn't work.
A Short Real Scenario
A single-location shop doing around 1,750 pieces a week couldn't figure out why net profit kept hovering near 5% despite steady volume. Building the service-level view took an afternoon. Alterations — always assumed to be the "premium" line — came in near breakeven once fixed costs were allocated by labor minutes, because one skilled tailor's time was absorbing a huge share of overhead for relatively little revenue.
They didn't drop alterations. They repriced the slowest, most labor-heavy jobs and set a rework alert at 1.5× baseline. Over the next quarter, rework labor dropped by roughly a third, and net margin moved from around 5% into the 8–9% range. Nothing dramatic in any single week — just a leak they finally saw, because the number existed instead of the hunch.
Wrapping Up
The reason most dry cleaners never build a real profit forecast isn't that they don't care about margin — it's that the technical work of formulas, schema, and alerts feels like a project without an end. Do it once with the pieces above, and it stops being a project. It becomes a screen you glance at, an alert that emails you, and a 30-minute monthly habit.
Start with the 4-week base/best/worst table. Add the formulas. Wire in conditional formatting. Everything else — the SQL, the event schema, Metabase — you graduate into when the manual work starts to sting. The math doesn't have to be perfect. It just has to exist, so the leaks have somewhere to show up.
The reason most dry cleaners never build a real profit forecast isn't that they don't care about margin — it's that the technical work of formulas, schema, and alerts feels like a project without an end. Do it once with the pieces above, and it stops being a project. It becomes a screen you glance at, an alert that emails you, and a 30-minute monthly habit.
Start with the 4-week base/best/worst table. Add the formulas. Wire in conditional formatting. Everything else — the SQL, the event schema, Metabase — you graduate into when the manual work starts to sting. The math doesn't have to be perfect. It just has to exist, so the leaks have somewhere to show up.
Ready to elevate your dry cleaning operations?
Join hundreds of dry cleaners using Pressesly to save time, reduce errors, and enhance customer satisfaction.