

Most dry cleaners track the wrong metrics. They obsess over garments processed per day while missing that their rework rate is quietly bleeding $800 a month. They celebrate hitting 500 weekly orders without noticing their average ticket dropped 15% over six months.
The real profit killers hide between the obvious numbers. A shop processing 400 items daily might look fine on paper, but dig deeper and you'll find 12% of those items need rework, delivery routes are eating 30% more fuel than they should, and counter staff spend nearly half their time on non-revenue tasks.
Running operational software for garment care businesses surfaces patterns most owners never catch. The shops doing well track different numbers than everyone else — not fancier metrics, just the right ones, measured at the right frequency, with clear triggers for action.
The hierarchy of dry cleaner KPIs that actually matter
Across dry cleaning operations, the metrics consistently fall into three buckets: survival metrics (check daily), health metrics (check weekly), and growth metrics (check monthly). Most shops mix these up — checking growth metrics every morning while ignoring survival metrics until something breaks.
Survival metrics keep your doors open tomorrow. These include same-day capacity utilization, rework percentage, and critical equipment downtime. When your pressing machine goes down and you're looking at monthly revenue trends instead of hourly throughput, you've already lost money.
One shop in downtown Miami learned this the hard way. They tracked total monthly revenue religiously but ignored daily rework. Their senior presser had developed a shoulder issue and quality dropped gradually. By the time revenue started declining, they'd already lost four commercial accounts worth $2,800 monthly. Rework had crept from 3% to 11% over two months — invisible in revenue reports, obvious in daily operational data.
Health metrics show whether your operation actually runs efficiently. Average turnaround time, cost per garment processed, route density for delivery. These won't kill you today but they compound into serious problems over weeks.
Growth metrics tell you where the business is heading. Customer lifetime value, acquisition cost, average ticket trends. Useful for planning, but checking them daily just creates noise.
The shops that survive track all three levels but respond differently to each. Survival metrics trigger immediate action. Health metrics trigger process adjustments. Growth metrics feed strategic planning — nothing more.
Building dashboards that diagnose problems, not just display them
Raw numbers mean nothing without context. A 4% rework rate sounds manageable until you realize it clusters on Tuesday and Wednesday when your backup presser works. Or that 80% of it is on silk blouses specifically.
Never lose track of an order again.
Pressesly helps you manage, track, and communicate every garment order seamlessly.
- Unified order management
- Real-time customer notifications
- Staff scheduling & workload tracking
No credit card required
Good dashboards show relationships, not just metrics. They answer: Does rework spike when daily volume exceeds 380 items? Do complaints correlate with specific employees or equipment? When delivery delays happen, is it routing, processing, or pickup causing the backup?
Morning Snapshot (check at 8 AM)
-
Items due today vs capacity remaining
-
Equipment status (anything down?)
-
Staff attendance vs scheduled
-
Yesterday's rework percentage
-
Rush orders in queue
Midday Checkpoint (check at noon)
-
Processing pace vs target
-
Bottleneck stations (where are items piling up?)
-
Delivery route completion percentage
-
New stain identification issues
Evening Review (check at 5 PM)
-
Items processed vs target
-
Tomorrow's capacity vs scheduled intake
-
Quality issues flagged
-
Customer complaints and compliments
-
Cash reconciliation variance
The structure matters less than the discipline of actually checking it. One shop owner in Phoenix built an elaborate dashboard but only opened it during monthly meetings. Another shop used a simple whiteboard updated hourly. The whiteboard shop caught problems faster — every time.
| Metric | Target Range | Yellow Flag | Red Flag | Action Trigger |
|---|---|---|---|---|
| Average turnaround | 2.0–2.5 days | >2.8 days | >3.2 days | Review bottleneck stations |
| Cost per item | $3.20–3.60 | >$3.80 | >$4.20 | Audit supply usage |
| Route efficiency | 85–90% | <82% | <78% | Reorganize delivery zones |
| Customer reactivation | 60–65% | <55% | <50% | Launch retention campaign |
| Equipment uptime | 94–97% | <92% | <88% | Schedule preventive maintenance |
Notice how each metric has clear thresholds and specific actions attached. Without predetermined triggers, dashboards are just expensive wallpaper.
This diagram shows a simple workflow for daily dashboard checks and escalating issues when thresholds are crossed.
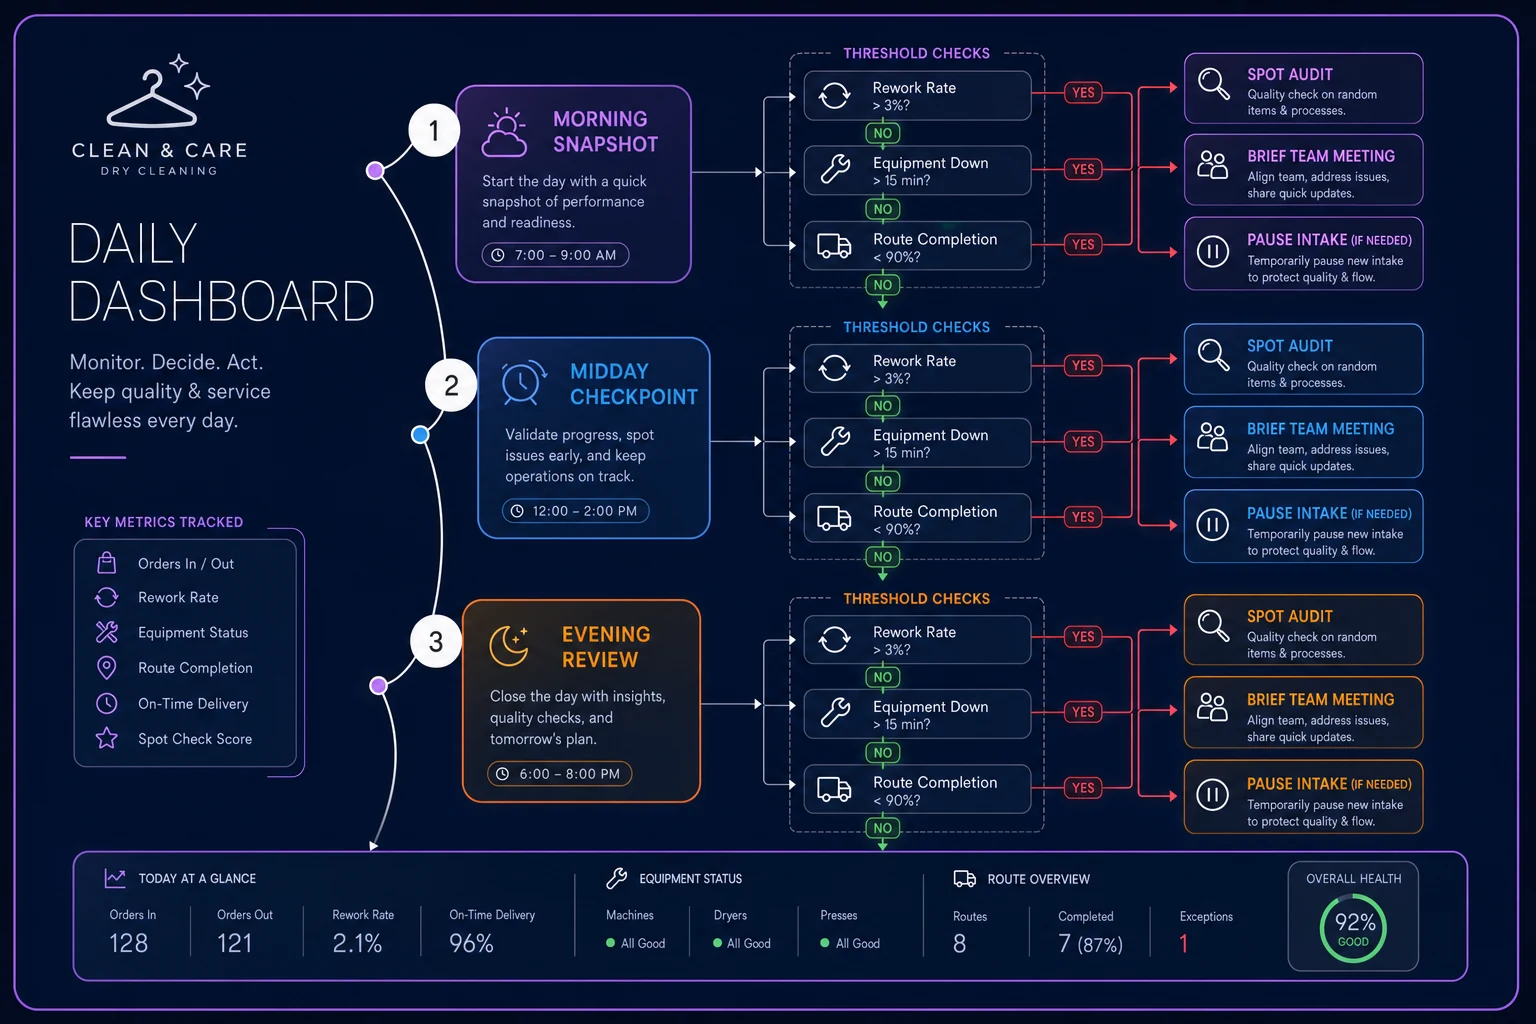
Keeping the steps visual makes it easy for staff to follow and for owners to train replacements quickly.
Diagnostic steps when KPIs slip
Numbers slipping is inevitable. What separates profitable shops from struggling ones is how fast they find the real cause. Most owners see a metric drop and immediately reach for the obvious explanation — revenue down, must need more marketing; complaints up, must be a staff problem.
Real diagnosis is more systematic. Take rework percentage, probably the most important daily metric for profitability. When it creeps above 5%, there's a diagnostic sequence that actually works:
-
Identify the pattern. Is rework concentrated on specific garment types? Specific days? Specific processes? One shop discovered their rework spiked every Monday — turned out their weekend part-timer had been running the wrong temperature settings on polyester blends for months.
-
Trace the workflow. Follow problem items through the entire process. Where do issues actually originate? A nearby shop thought they had a pressing problem until they traced rework items and found 70% had stains missed during intake inspection.
-
Check for changes. What's different from when metrics were good? New employee? Different supplier? Equipment wear? Changed procedures? Sometimes the smallest adjustment cascades into a major issue weeks later.
-
Measure the variance precisely. Don't just note that rework increased — measure exactly how much, on what items, during what shifts. Specificity reveals solutions that vague observations hide.
A diagnostic framework for common problem areas:
When delivery complaints spike:
-
Map actual routes vs planned routes
-
Check driver arrival times vs promised windows
-
Review garment ready times vs pickup schedules
-
Identify if issues cluster geographically
-
Analyze complaint specifics (late, wrong items, damaged, etc.)
When processing costs increase:
-
Audit chemical usage per garment type
-
Check utility consumption patterns
-
Review overtime hours and causes
-
Track supply waste and damaged goods
-
Compare actual vs standard processing times
When customer retention drops:
-
Segment by customer type and value
-
Review last transaction before churn
-
Check complaint history for churned customers
-
Analyze pricing changes impact
-
Survey recent departures for specific reasons
The diagnosis tells you whether you're dealing with a people problem, a process problem, or an equipment problem. Each requires a different fix, and guessing wrong wastes time and money.
Concrete action triggers based on metric thresholds
Metrics without triggers are just expensive entertainment. Every tracked number needs a predetermined response threshold — not suggestions, not guidelines, specific actions that happen when a metric crosses a line.
Rework Rate Triggers:
-
Above 3%
Spot audit next 20 items processed
-
Above 5%
Hold 10-minute quality meeting at shift change
-
Above 7%
Pause intake, review all items in process
-
Above 10%
Implement 100% inspection protocol for 48 hours
Capacity Utilization Triggers:
-
Below 70%
Launch same-day pickup promotion
-
Below 60%
Reduce part-time hours next week
-
Above 90%
Open overtime slots
-
Above 95%
Activate overflow partner agreement
Customer Complaint Triggers:
-
1 complaint
Log and acknowledge within 2 hours
-
2 complaints, same issue
Process review within 24 hours
-
3 complaints, same issue
Mandatory retraining within 48 hours
-
5 complaints any type in a week
Owner reviews all personally
The value here is removing real-time decision-making. When rework hits 5.2%, you don't debate whether it's worth addressing — the trigger already decided. You just execute the response.
Some triggers need escalation paths. A shop in Denver built this matrix for turnaround delays:
-
Day 1 delay
Customer gets a text update
-
Day 2 delay
Customer gets 20% discount
-
Day 3 delay
Manager calls personally
-
Day 4+ delay
Free cleaning plus future credit
That removed daily arguments about how to handle delays. Staff knew exactly what to do, customers got consistent treatment, and the owner could focus on preventing delays rather than managing fallout.
The compound effect of margin erosion through invisible metrics
The metrics that quietly kill dry cleaning profitability rarely announce themselves. They're slow leaks, not burst pipes. A half-percent here, two minutes there, one extra trip occasionally. Individually meaningless. Together, they decide whether you net 8% or 18% margins.
Consider "ghost labor" — work that produces no revenue. Counter staff sorting hangers. Pressers reorganizing racks. Drivers waiting on orders not ready yet. Most shops never measure this, but it typically consumes 15–20% of payroll. One shop installed basic time-tracking and discovered their counter staff spent 90 minutes daily organizing supplies that could have been pre-sorted once a week.
Then there's "remake revenue" — the hidden cost when customers complain and you clean items again for free. It shows up as regular volume in production metrics but generates zero revenue while consuming full costs. A shop processing 400 items daily might remake 15–20 items. At $3.50 processing cost, that's roughly $350–450 weekly in losses that don't appear anywhere obvious.
-
2% higher rework = $750/month cost
-
5 minutes extra per route = $400/month labor
-
3% more chemical waste = $200/month supplies
-
10% ghost labor = $1,800/month payroll
-
4% remake rate = $1,400/month opportunity cost
That's around $4,550 in monthly profit erosion from inefficiencies most owners consider minor. On $50k monthly revenue, that's the gap between scraping by and actually building something.
Sample tracking spreadsheet and weekly review cadence
Fancy software helps, but a basic spreadsheet beats no tracking at all. The key is consistency — same metrics, same time, same format every week.
Daily Tracking Sheet:
``
Date:
Opening WIP count: _
Items received: _
Items processed: _
Items delivered/picked up: _
Closing WIP count: _
Rework count: _
Rush orders: _
Equipment issues: _
Staff issues: _
Customer complaints: __
``
Takes five minutes to complete and captures 80% of what matters. The trick is calculating week-over-week trends from these daily numbers.
Weekly Analysis Routine:
-
Compile last week's daily sheets
-
Calculate weekly averages and totals
-
Compare to previous 4-week average
-
Identify top variance from target
-
Assign one improvement action
-
Post targets for current week
Don't overcomplicate the review. Pick the worst-performing metric and fix that one thing. A shop trying to improve everything simultaneously usually improves nothing.
One successful owner runs the weekly meeting like this:
-
10 minutes
Review numbers without commentary
-
15 minutes
Discuss the biggest problem only
-
15 minutes
Agree on a single solution to test
-
5 minutes
Assign ownership and deadline
Short, focused, actionable. No philosophical debates about why customers are difficult or why employees don't care. Numbers, problems, solutions, ownership.
Technology leverage points for automated KPI tracking
Manual tracking works but starts breaking down around 300 items daily. Beyond that, you need system support or metrics become another full-time job.
Start with transaction-level automation. Every garment tagged, every payment processed, every delivery completed — these should feed your metrics automatically. Modern operational platforms handle this through barcode scanning or RFID, eliminating manual counts while improving accuracy.
Next, automate calculations and alerts. Instead of calculating rework percentage by hand each day, let software track it continuously and alert you at thresholds. Instead of checking equipment runtime manually, let sensors monitor and report. The shift is from data entry to decision-making.
Where automation really earns its keep is pattern recognition. Humans miss subtle correlations that software catches easily — like your Wednesday rework rate running twice Tuesday's, but only on weeks following Monday holidays. Or delivery complaints spiking when afternoon temperatures exceed 95°F. These patterns hide in manual tracking but surface quickly with automated analysis.
Where shops go wrong is automating everything at once and drowning in data. One shop spent $15k on comprehensive tracking software, then ignored it because it generated 47-page weekly reports nobody actually read.
The practical sweet spot for most shops:
-
Item flow tracking (intake through delivery)
-
Time stamps at each process step
-
Customer interaction logging
-
Basic financial metrics
-
Exception alerting
Start automating with item flow tracking and exception alerts before adding predictive features.
This covers survival and health metrics while leaving growth metrics for manual strategic review. Expand automation gradually from there as operations stabilize.
AI-powered platforms take this further — not just tracking but predicting. They notice when certain patterns tend to precede problems and surface alerts before metrics deteriorate. A shop in Austin gets alerts like "Rework typically spikes when tomorrow's scheduled volume exceeds 430 items with current staffing," letting them adjust proactively rather than react after the fact.
The progression happens in stages: first you eliminate manual counting, then automate reporting, then add predictive alerts, and eventually the software is suggesting specific operational adjustments based on pattern analysis. Each stage builds on the last.
The realistic profit impact of KPI discipline
A typical dry cleaner running 350 items daily at an $8 average ticket generates roughly $70k monthly revenue. Without KPI discipline, they net maybe 8–12% margins. With proper tracking and triggers, the same operation can reach 18–22%. That's a $7k–10k monthly difference in what actually hits the owner's pocket.
The improvement doesn't come from one dramatic fix — it's dozens of small things compounding:
-
Rework dropping from 6% to 2% saves roughly $1,100/month
-
Route optimization cuts delivery cost by around $800/month
-
Reducing turnaround time by half a day improves cash flow by $3,500
-
Eliminating ghost labor frees up $1,400/month in payroll
-
Better capacity utilization adds $2,000/month in revenue
-
Supply waste reduction saves $400/month
None of this requires major capital investment or dramatic operational overhauls. It comes from measuring the right things and responding consistently when metrics drift.
A shop in Orlando documented their trajectory. Started at 9% net margin with no systematic tracking. After six months of disciplined KPI management:
-
Rework
7.2% → 2.8%
-
Turnaround
3.1 days → 2.3 days
-
Delivery cost per item
$1.20 → $0.85
-
Customer retention
68% → 79%
-
Net margin
9% → 19%
The owner didn't work more hours. They just stopped fighting daily fires and started managing by metrics. Problems surfaced earlier, solutions went in faster, and improvements stuck because the data showed what actually worked.
Building your measurement rhythm without burning out
The biggest barrier to KPI success isn't complexity — it's consistency. Owners start strong, track everything for two weeks, then abandon the system when things get busy. Exactly when they need the metrics most.
The fix is building measurement into existing operational rhythm, not adding it on top. Make metrics part of opening routines, shift changes, and closing procedures. When tracking is embedded in workflow, it sustains itself.
Start simple. Pick three metrics that matter most to your specific situation — maybe rework rate, turnaround time, and daily revenue. Track just those for 30 days until the habit is solid. Then add one metric monthly until you've built a complete picture.
Design your tracking for your worst day, not your best. If the system requires 30 minutes of quiet analysis, it'll collapse during holiday rush. If it needs perfect data entry, it'll fail when your best employee calls in sick. Build something that holds up when everything's going sideways.
Create forcing functions that make tracking unavoidable. One owner locks the register until daily metrics are entered. Another sets phone reminders every four hours. A third prints tracking forms on the back of closing checklists. Whatever ensures it actually happens.
Most importantly, connect metrics to immediate value. When staff see that tracking rework leads to easier days and fewer complaints, they'll maintain the system. When owners see margins improve month over month, they'll protect measurement time.
The shops that win long-term don't have perfect systems. They have consistent systems that slowly get better as metrics reveal what to fix. Your dry cleaning operation is essentially a production system with customer service wrapped around it — the metrics you track determine whether that system improves or degrades over time. Choose them carefully, track them consistently, respond to them systematically, and the compound effect over months and years is the difference between struggling to cover bills and actually building wealth.
Ready to elevate your dry cleaning operations?
Join hundreds of dry cleaners using Pressesly to save time, reduce errors, and enhance customer satisfaction.