

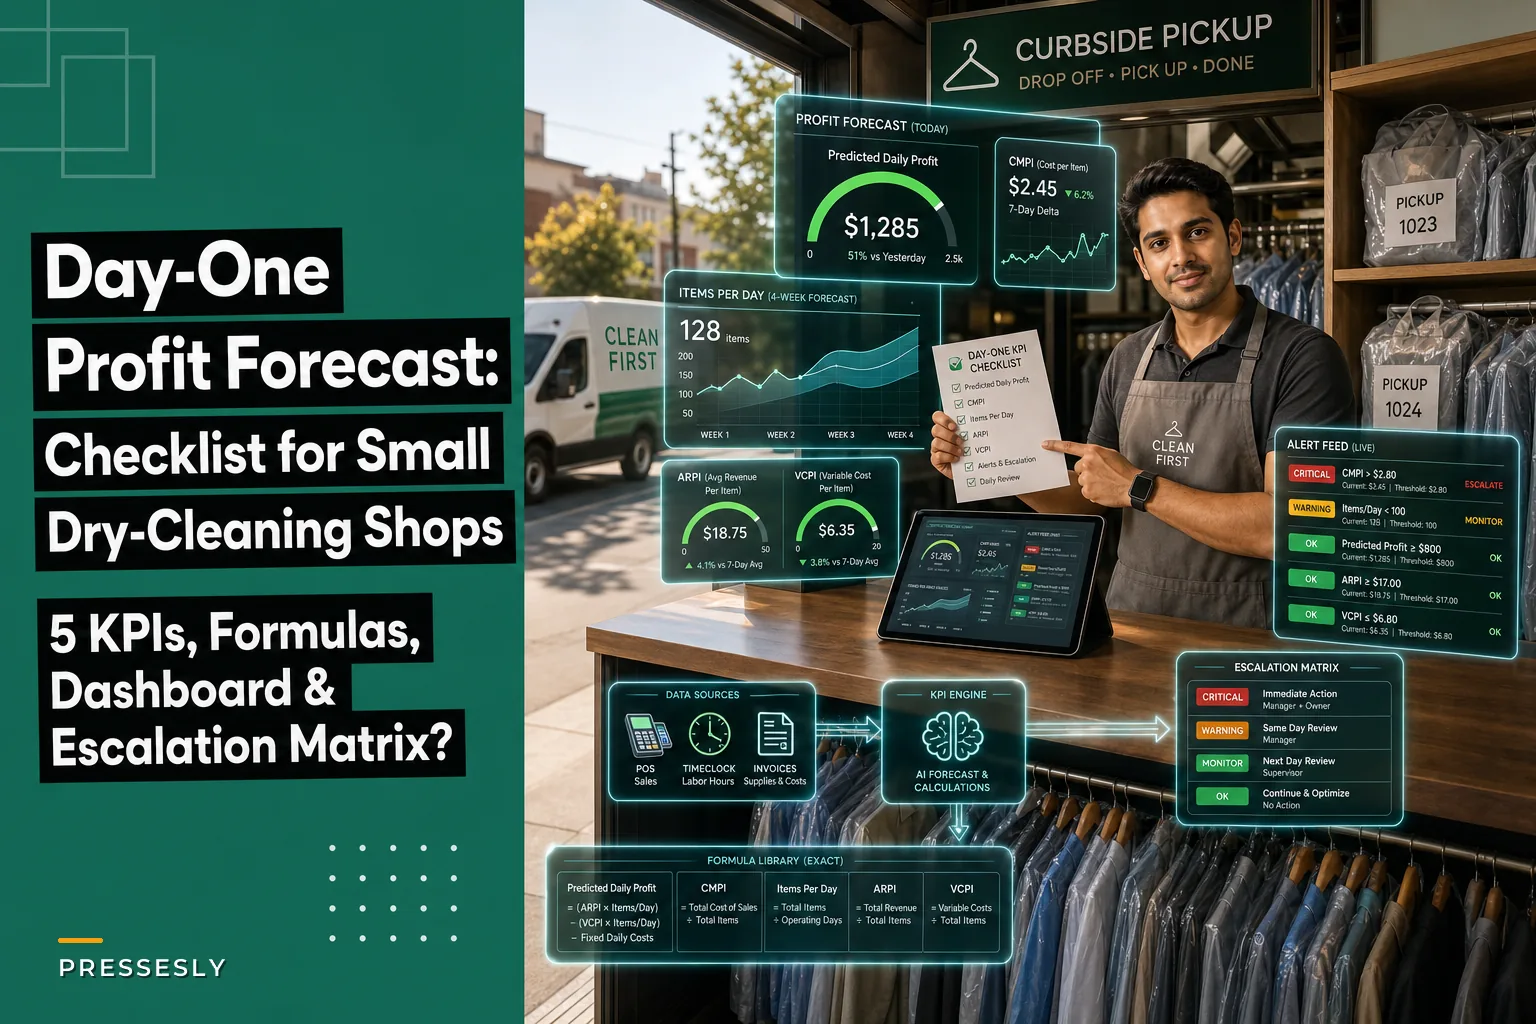

Most owners who want to "start forecasting profit" spend three weeks building a beautiful spreadsheet that nobody opens again. The reason is simple: they try to model everything. Every service line, every cost bucket, every seasonal wrinkle. By the time it's "done," the numbers are stale and the owner is back to guessing from the till.
You don't need that. You need five numbers you can pull today, a formula for each, thresholds that tell you when to worry, and a rule for who gets pinged when something breaks. That's the whole job. This is a one-day build.
If you've already read about which KPIs actually predict profit at a dry cleaning shop, this is the hands-on companion — less theory, more build-it-before-lunch.
The 5 KPIs you build first (and nothing else on day one)
The temptation is to track 15 things. Don't. These five work because together they turn raw counts and dollars into a contribution margin and a profit prediction. Everything else is week-two territory.
1. Items Processed per Day (throughput)
Formula:
Items Processed = count of garment line-items marked "ready" or "completed" for the day
Data fields: ticketid, lineitemid, garmenttype, status, status_timestamp
This is your denominator for almost everything. A common mistake is counting tickets instead of garments. A ticket with 8 shirts and a comforter is one ticket but nine pieces of work. Track pieces.
2. Average Revenue per Item (ARPI)
Formula:
ARPI = Net Revenue (after discounts, before tax) / Items Processed
Data fields: lineitemrevenue, discountamount, taxamount, void_flag
Strip tax and voids out. If you leave tax in, your margins look better than they are and you'll price wrong.
3. Variable Cost per Item (VCPI)
Formula:
VCPI = (Solvent + Detergent + Hangers + Poly/Packaging + Direct Labor Minutes × Labor Rate + Utilities-per-cycle) / Items Processed
Data fields: supplycostperiod, packagingcostperiod, laborminutes, hourlyrate, utilitycostperiod
This is the one people fudge. You don't need garment-level precision on day one. Take last month's total variable spend, divide by last month's item count, and you have a working per-item cost. Refine it later.
4. Contribution Margin per Item (CMPI)
Formula:
CMPI = ARPI − VCPI
The single most important number on the whole dashboard. It tells you how many cents each garment actually contributes toward rent, insurance, and your paycheck. If this goes negative, you are paying customers to bring you laundry.
5. Predicted Daily Profit
Formula:
Predicted Daily Profit = (Forecasted Items × CMPI) − Daily Fixed Costs
Data fields: monthlyfixedcosts (rent, insurance, salaried staff, loan payments, base utilities) → divide by operating days.
Five KPIs. Four of them feed the fifth. Build only these today and you can forecast profit tonight.
A worked example: from raw inputs to predicted profit
Real numbers so you can see the chain. This is a mid-size shop doing around 380 pieces a day.
Never lose track of an order again.
Pressesly helps you manage, track, and communicate every garment order seamlessly.
- Unified order management
- Real-time customer notifications
- Staff scheduling & workload tracking
No credit card required
Raw inputs (last full month, 26 operating days):
-
Total pieces processed
~9,880
-
Net revenue (after discounts, pre-tax)
about $67,400
-
Variable spend (supplies, packaging, direct labor, per-cycle utilities)
roughly $28,600
-
Monthly fixed costs (rent, insurance, salaried counter staff, loan)
around $23,500
Step through it:
-
Items/day = 9,880 ÷ 26 ≈ 380 pieces/day
-
ARPI = $67,400 ÷ 9,880 ≈ $6.82 per item
-
VCPI = $28,600 ÷ 9,880 ≈ $2.90 per item
-
CMPI = $6.82 − $2.90 = $3.92 per item
-
Daily fixed cost = $23,500 ÷ 26 ≈ $904/day
-
Predicted daily profit = (380 × $3.92) − $904 = $1,489.60 − $904 ≈ $586/day
Over a 26-day month that's roughly $15,200 in operating profit before taxes and owner draw.
Now the useful part — sensitivity. If throughput slips to 340 pieces during a soft week, profit drops to (340 × $3.92) − $904 ≈ $429/day. A 40-piece dip costs about $157 a day. That's the kind of thing you want the dashboard flagging mid-shift, not after the month closes.
And if a supplier raises hanger and poly prices enough to push VCPI to $3.20, CMPI falls to $3.62. At 380 pieces your daily profit drops to roughly $472. Same volume, same revenue, $114/day gone. This is why VCPI has to live on the dashboard, not in a folder you open quarterly.
The single-screen dashboard wireframe
``
┌─────────────────────────────────────────────────────────────┐
│  TOP BAR:  Date | Shop Name | Throughput Band: 200–500       │
├───────────────────────────┬─────────────────────────────────┤
│  BIG GAUGE (top-left)      │  BIG NUMBER (top-right)          │
│  Predicted Daily Profit    │  CMPI — Contribution/Item        │
│  green/yellow/red arc      │  $3.92  ▲/▼ vs 7-day avg         │
│  updates: end of day       │  updates: hourly                 │
├───────────────────────────┼─────────────────────────────────┤
│  LINE CHART (mid-left)     │  TWO SMALL GAUGES (mid-right)    │
│  Items/Day — last 28 days  │  ARPI  |  VCPI                   │
│  + 4-week forecast band    │  color-coded to band            │
│  updates: hourly           │  updates: hourly                 │
├───────────────────────────┴─────────────────────────────────┤
│  BOTTOM STRIP: Alert Feed (last 5 threshold breaches)        │
│  color chips + who was notified + timestamp                  │
│  updates: real-time                                          │
└─────────────────────────────────────────────────────────────┘
``
Why this arrangement: the eye goes top-left first, so predicted profit sits there. CMPI is top-right because it's the number that explains why profit moved. The line chart shows the trend and forecast band together so you can see if today is on pace. The alert strip at the bottom is your "do I need to act right now" row.
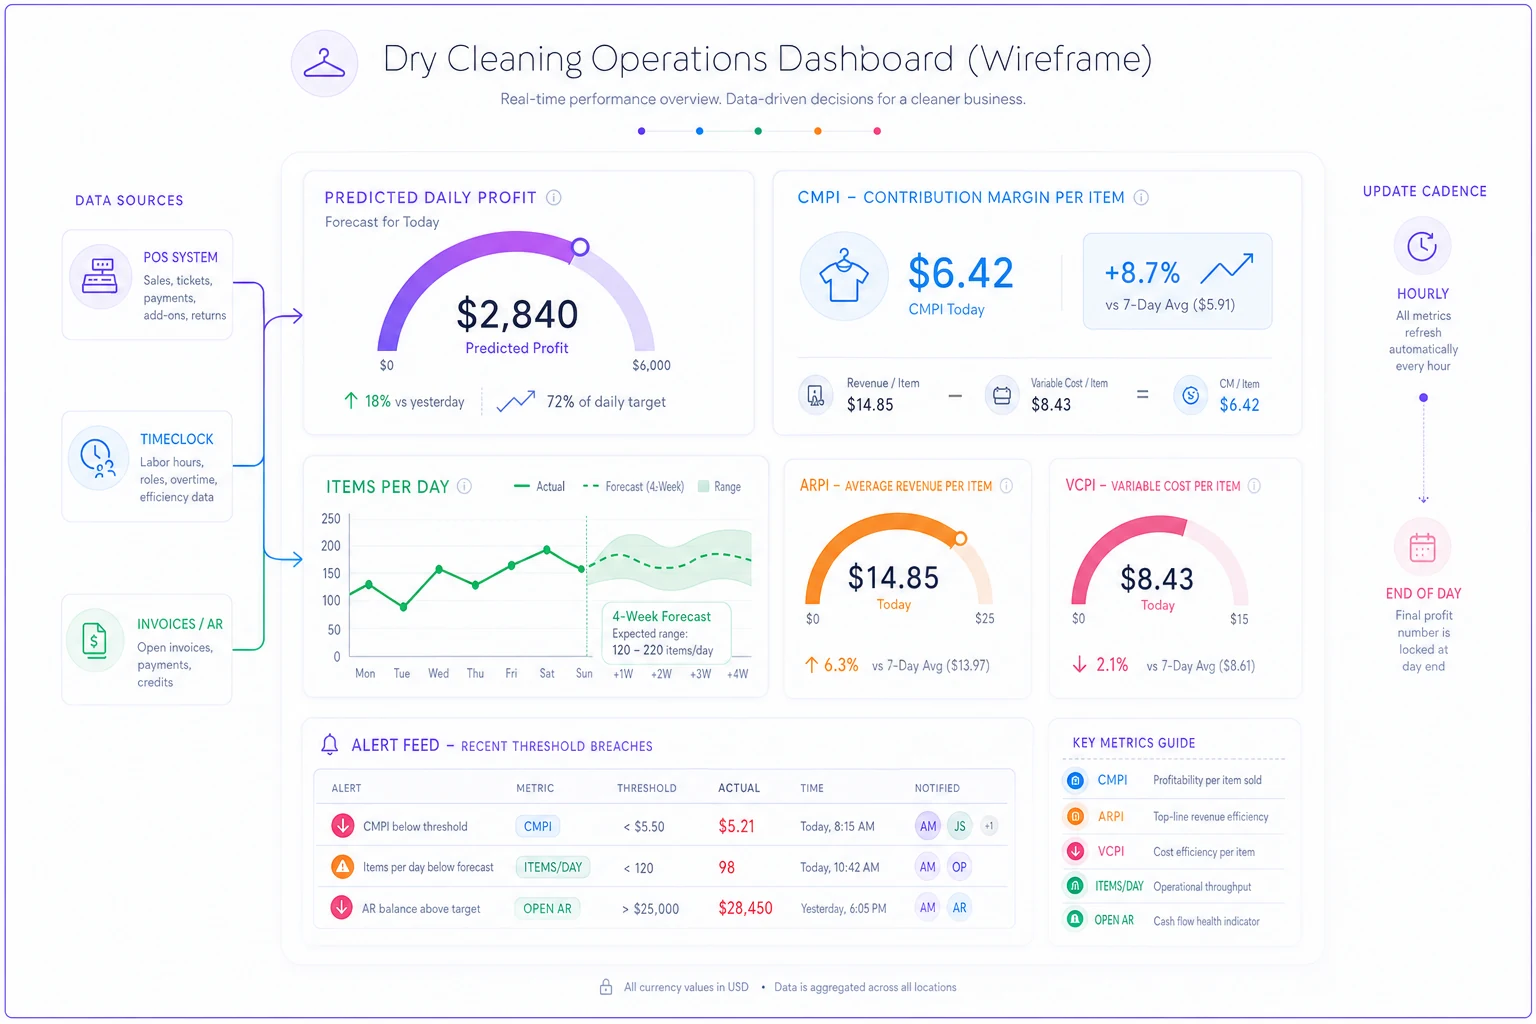
Update cadence matters. ARPI, VCPI, CMPI, and the items chart refresh hourly during business hours — frequent enough to catch a bad day mid-shift but not so twitchy you're reacting to a slow 10 a.m. Predicted profit locks at end of day because it depends on the final item count. The alert feed is real-time.
Data lineage: where every number actually comes from
The most common reason dashboards like this die is that the data doesn't connect cleanly. Here's the field mapping so you know exactly which system feeds which number.
| KPI / Field | Source System | Table/Field | Refresh |
|---|---|---|---|
| Items Processed | POS | line_items.status = completed | Hourly |
| Line revenue, discounts, tax | POS | line_items.revenue, .discount, .tax | Hourly |
| Void/refund flags | POS | transactions.void_flag | Hourly |
| Direct labor minutes | Timeclock | shifts.clock_in/out, dept tag | Daily |
| Hourly labor rate | Payroll/Timeclock | employees.rate | On change |
| Supplies & packaging cost | Invoices/AP | invoices.category = supplies | Weekly |
| Utilities per cycle | Invoices | invoices.category = utility ÷ cycles run | Monthly |
| Fixed costs | Invoices/manual | rent, insurance, loans | Monthly |
Two lineage problems come up constantly:
-
Timeclock without department tags. If your timeclock doesn't separate pressing labor from counter labor, your VCPI gets polluted with fixed-ish counter time. Tag shifts by role even if it's just a manual dropdown.
-
Invoices booked to the wrong period. A supply invoice that lands on the 2nd but covers last month will spike VCPI for one day. Book supply costs to the period consumed, not the invoice date.
This is exactly the kind of stitching where an AI-assisted operational platform earns its keep — pulling POS line items, matching timeclock shifts, and categorizing invoices into the right cost buckets automatically, so your VCPI isn't dependent on someone remembering to code an invoice correctly. That said, you don't need any of that on day one. A weekly manual pull works fine to start.
SQL and spreadsheet snippets to get the numbers out
If your POS allows direct queries, here's the core pull for daily throughput and revenue:
SELECT DATE(statustimestamp) AS bizday, COUNT(lineitemid) AS itemsprocessed, SUM(lineitemrevenue - discountamount) AS netrevenue, ROUND(SUM(lineitemrevenue - discountamount) / NULLIF(COUNT(lineitemid),0), 2) AS arpi FROM lineitems WHERE status = 'completed' AND voidflag = 0 GROUP BY DATE(statustimestamp) ORDER BY bizday;
For contribution margin, once you have your variable cost total for the period:
SELECT bizday, arpi, round(:variablecostperiod / :itemsperiod, 2) AS vcpi, round(arpi - (:variablecostperiod / :itemsperiod), 2) AS cmpi FROM dailyrevenue;
If SQL isn't your thing, the spreadsheet version works fine. Set up columns A: Date, B: Items, C: NetRevenue, D: VarCostPeriod, E: ItemsPeriod, F: FixedDaily:
-
ARPI
=C2/B2 -
VCPI
=$D$2/$E$2 -
CMPI
=(C2/B2)-($D$2/$E$2) -
Predicted Daily Profit
=(B2*((C2/B2)-($D$2/$E$2)))-F2
Lock the period cells with $ so you're not re-entering them on every row.
Green / yellow / red thresholds by throughput band
Thresholds only make sense relative to your volume. A CMPI that's healthy for a 150-piece boutique shop is thin for a 600-piece operation with heavier fixed costs. Use these as starting bands and tune after two weeks of real data.
| Metric | Band: <200 items/day | Band: 200–500 items/day | Band: >500 items/day |
|---|---|---|---|
| CMPI (green) | ≥ $4.50 | ≥ $3.75 | ≥ $3.25 |
| CMPI (yellow) | $3.50–$4.49 | $3.00–$3.74 | $2.60–$3.24 |
| CMPI (red) | < $3.50 | < $3.00 | < $2.60 |
| Items vs forecast (green) | within 15% | within 12% | within 10% |
| Items vs forecast (yellow) | 15–25% off | 12–20% off | 10–18% off |
| Items vs forecast (red) | > 25% off | > 20% off | > 18% off |
| VCPI creep (red) | up > 12% MoM | up > 10% MoM | up > 8% MoM |
The logic behind the CMPI bands: smaller shops carry lower fixed costs but also do lower volume, so they need a fatter margin per piece to cover their overhead. Larger shops can survive on thinner per-piece margins because volume covers fixed costs — but they're also more exposed when volume dips, which is why their "items vs forecast" tolerance is tighter.
The forecast method: 4-week rolling + light exponential smoothing
You don't need a machine-learning model to forecast next week's item count. A rolling average that leans slightly toward recent weeks is enough.
-
Pull the last 4 weeks of daily item counts, keeping days-of-week separate. Monday's forecast should be built from recent Mondays, not from Saturdays.
-
Compute a simple 4-week average per weekday. That's your baseline.
-
Apply light exponential smoothing so last week counts more than four weeks ago. Use a smoothing factor (alpha) of about 0.3:
Forecast = (0.3 × last week) + (0.7 × prior smoothed value)Keep alpha low. A high alpha makes your forecast whip around after one weird week. -
Multiply the weekday forecast by CMPI to get expected contribution, then subtract daily fixed cost for predicted profit.
A worked snippet: if recent Tuesdays ran 402, 388, 371, and last week's smoothed value was 389, then:
Forecast = (0.3 × 402) + (0.7 × 389) ≈ 393 pieces
At CMPI $3.92, that's about $1,541 contribution, minus $904 fixed ≈ $637 predicted profit for that Tuesday.
Validation checklist
-
Forecast error under 15% on at least 8 of 10 weekdays
-
No single weekday consistently over- or under-predicting (that's a bias — adjust the weekday baseline)
-
CMPI feeding the forecast matches your actual month-end contribution within 5%
-
VCPI recalculated at least once during the two weeks (supply prices drift)
-
Holidays and known closures manually flagged, not left to skew the average
-
Forecast band visibly widens on volatile weekdays instead of showing false precision
If it passes, you can start making staffing and rush-capacity calls off it. If it fails, the usual culprit is dirty item counts — voids or re-cleans double-counting.
Owner / escalation matrix: who gets pinged when
A dashboard nobody acts on is wallpaper. Every alert needs an owner and a next step.
| Alert | Trigger | First Owner | Escalates To | Action Window |
|---|---|---|---|---|
| CMPI red | CMPI below band floor for the day | Shop Manager | Owner | Same day |
| VCPI creep | VCPI up beyond band MoM threshold | Manager | Owner + supplier review | 48 hours |
| Volume red | Items >X% below forecast | Front Counter Lead | Manager | Same shift |
| Predicted profit negative | Daily profit forecast < $0 | Manager | Owner immediately | Immediate |
| Void/refund spike | Voids > 4% of tickets | Manager | Owner if repeats | Same day |
| Forecast bias | 3 straight days same-direction miss | Whoever owns the sheet | — (recalibrate) | Weekly |
The rule that makes this work: every red must produce either an action or a written "no action needed because ___" note. Silent reds train everyone to ignore the colors within a week. I've watched perfectly good dashboards go grey — not because the data was wrong, but because a red flashed for three days, nobody wrote down why, and the whole team quietly stopped believing the screen.
When this day-one build is enough — and when it isn't
This works well if you're a single location doing under around 600 pieces a day, you have a POS that exports line items, and you're comfortable pulling numbers once a week to start. Five KPIs on one screen will catch the vast majority of profit leaks — margin compression, volume dips, cost creep — long before month-end surprises you.
This isn't enough if you're running multiple sites with shared central plant costs, or your service mix swings wildly (heavy formalwear seasons, big corporate contracts with different margins). At that point a blended CMPI hides too much, and you'll want per-service-line contribution margins. That's a week-two problem, not a reason to delay building the basics today.
Skip the fancy version entirely if you don't yet trust your item counts. Fix the counting first. A precise forecast built on garbage counts is worse than a rough guess, because it feels authoritative.
A quick real scenario
Two owners running about 310 pieces a day thought they were doing fine — revenue looked steady month to month. When they finally built these five KPIs, ARPI was healthy at around $7.10, but VCPI had crept to $3.85 without anyone noticing. Mostly a hanger and poly price bump, plus overtime on pressing on Thursdays. CMPI was sitting at roughly $3.25 — technically green for their band, but trending the wrong direction.
They caught it because the VCPI gauge flipped yellow two weeks running. Renegotiating packaging and shifting one press shift earlier knocked VCPI back to about $3.55. On 310 pieces a day that recovered roughly $90/day — call it $2,300 or so over the quarter. Nothing dramatic. Just money that was quietly leaking, now not.
That's the whole point of a day-one build. You're not trying to model the business perfectly. You're trying to see the leaks while they're still small.
Build it today, refine it forever
The five KPIs, the thresholds, the escalation matrix — you can stand all of it up in an afternoon with a spreadsheet and a POS export. The forecast method is a rolling average with a gentle lean toward recent weeks, not a data-science project. The single-screen layout exists so that checking your profit health takes ten seconds, not ten minutes.
Start rough. Use last month's totals for your first VCPI. Let the thresholds be approximate. Then tighten them as two weeks of real data comes in. The shops that actually forecast profit aren't the ones with the fanciest models — they're the ones who built something simple enough to check every single day and actually did.
Start rough. Use last month's totals for your first VCPI. Let the thresholds be approximate. Then tighten them as two weeks of real data comes in. The shops that actually forecast profit aren't the ones with the fanciest models — they're the ones who built something simple enough to check every single day and actually did.
Ready to elevate your dry cleaning operations?
Join hundreds of dry cleaners using Pressesly to save time, reduce errors, and enhance customer satisfaction.